Matti Leskinen 2012-01-31
Thunderstorms 2010-08-08
Structures of an outdoor concert stage were broken by downburst
in Pori,
obviously at about 13 UTC.
Large hail, diameter reaching about 5 cm,
in Sastamala, probably at about
14 UTC.
High winds around Helsinki at the front edge of thunderstorms from south,
after 18 UTC.
Insect migration crossing the sea was observed
at the front edge of the thunderstorm cells, including large insects.
Kumpula and Järvenpää weather
Kumpula 15-22 UTC
radiation and precipitation
SMEAR mast radiation sensors, Ott Pluvio precipitation on the roof of Physicum,
Ott time shifted 4 minutes earlier.
Kumpula and Järvenpää
temperatures
Averages of one minute periods.
Kumpula and Järvenpää
wind speed
Average speed of one minute periods.
Kumpula and Järvenpää
wind speed
Average speed and maximum speed of one minute periods.
Due to the recording interval in Kumpula the maximum speed
values are for 10 s periods at this site.
Kumpula
precipitation
visibility
wind speed
temperature
Precipitation rate by Ott Pluvio on the Physicum roof with time shift
6 min earlier, to match the visibility sensor record.
Visibility by Vaisala PWD11 on the Physicum roof.
Temperature in the SMEAR mast at 32 m.
Wind speed and virtual temperature by sonic anemometer in the SMEAR mast
at 16 m level.
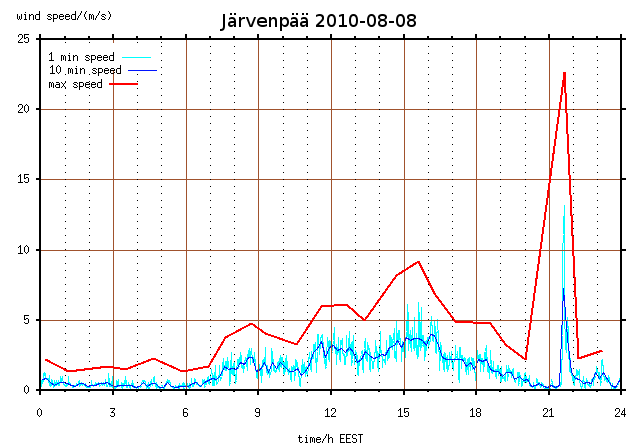
Wind speed
00-24 EEST
Maximum speed of 3 s averages during the hour, the standard parameter, and
averages of 1 and 10 minute periods.
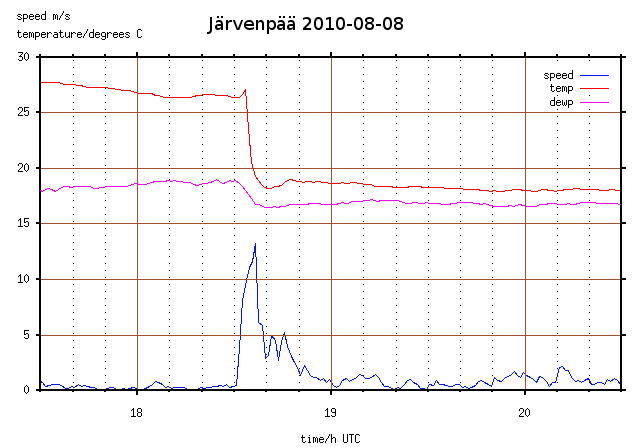
Wind speed
temperature
dewpoint
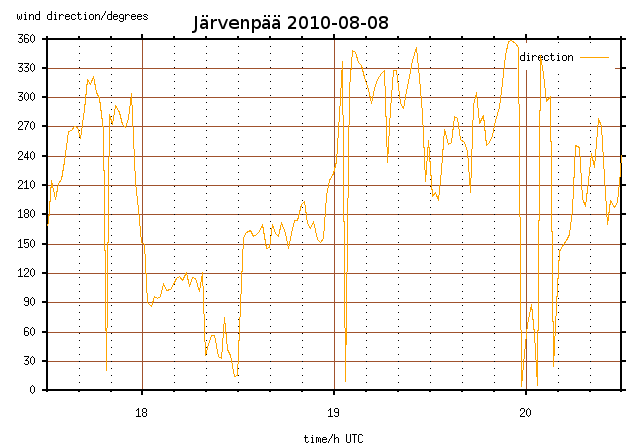
Wind direction
Averages of one minute periods.
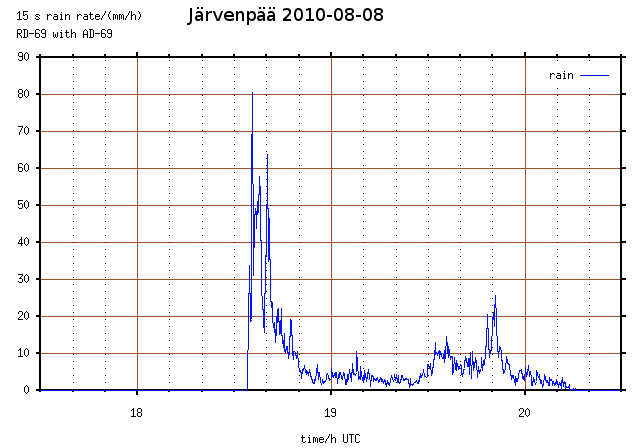
Rainfall rate
Distromet RD-69 with AD-69.
Kumpula radar wind soundings
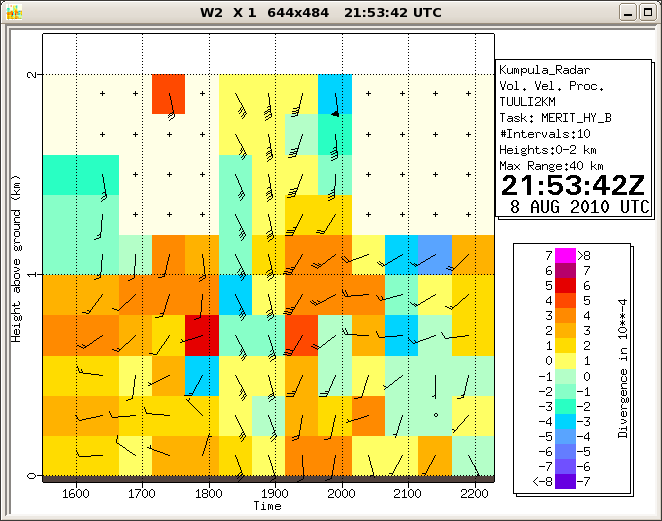
Dual PRF 16-22 UTC
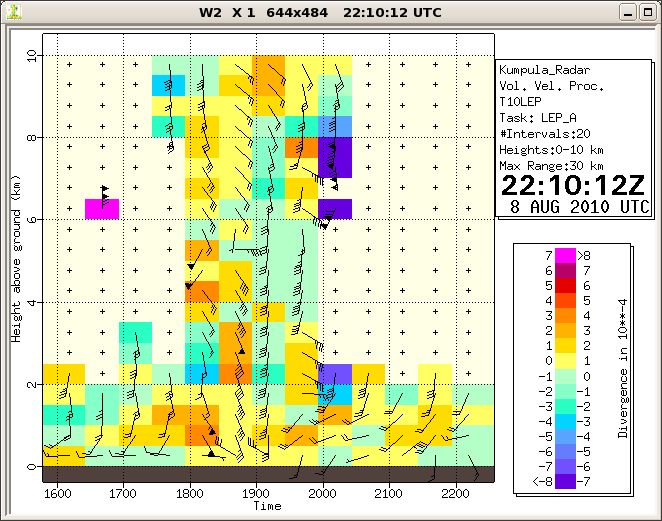
High PRF 16-22 UTC
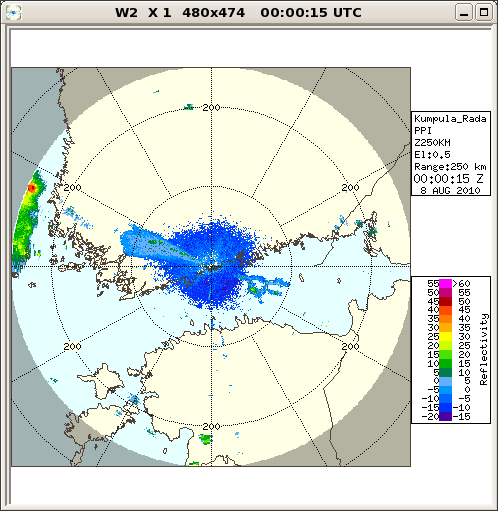
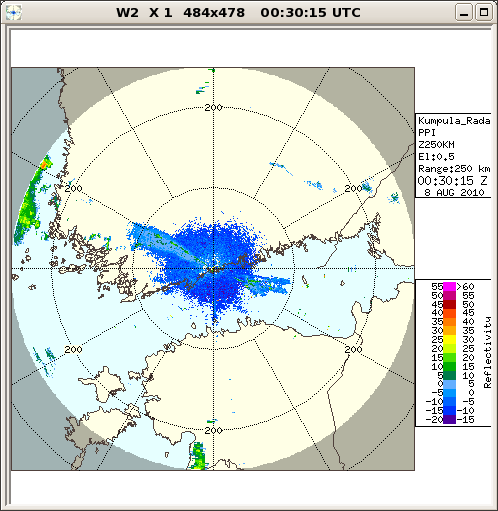
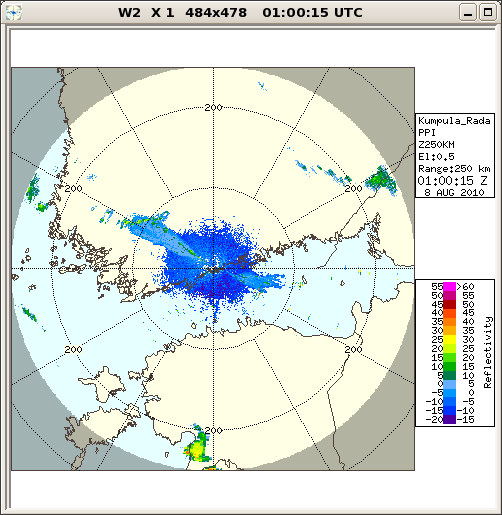
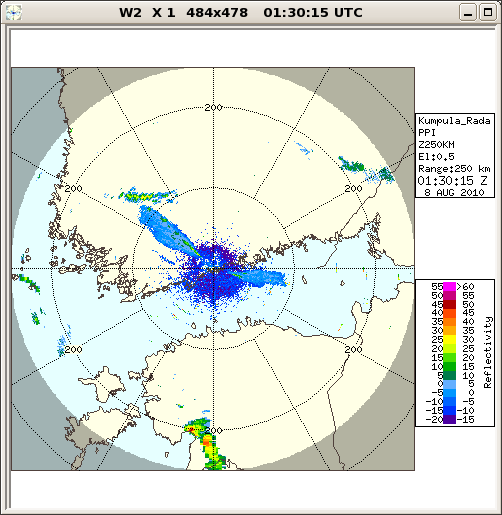
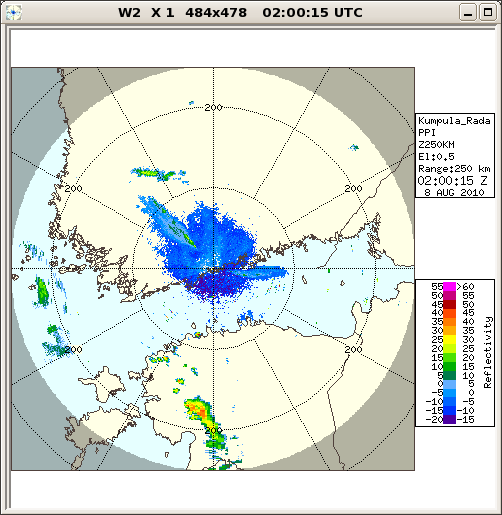
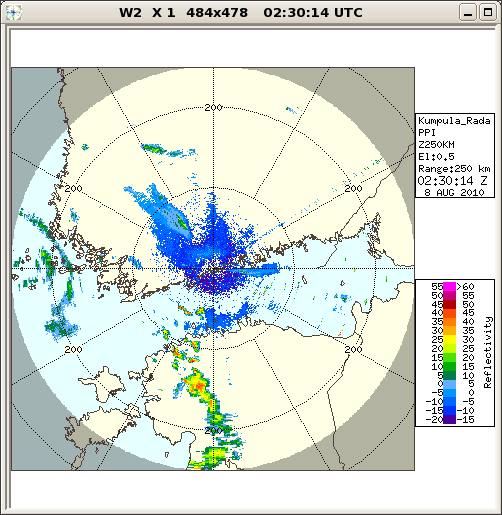
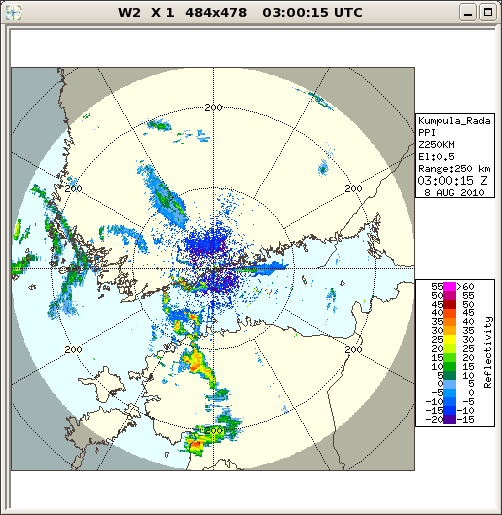
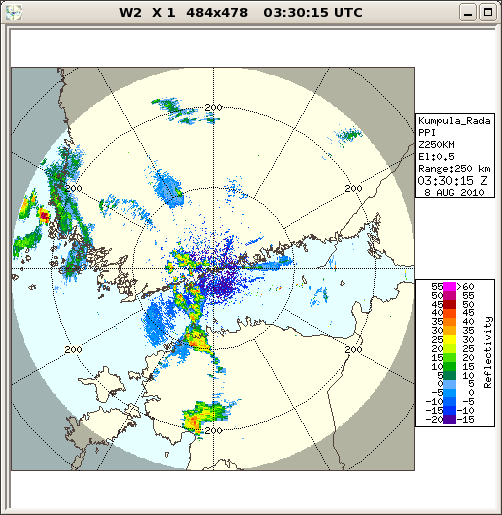
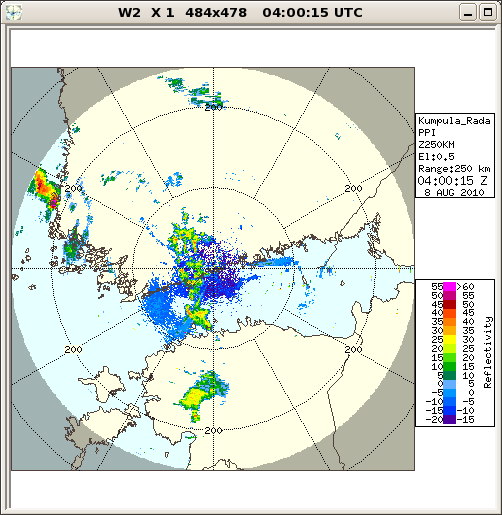
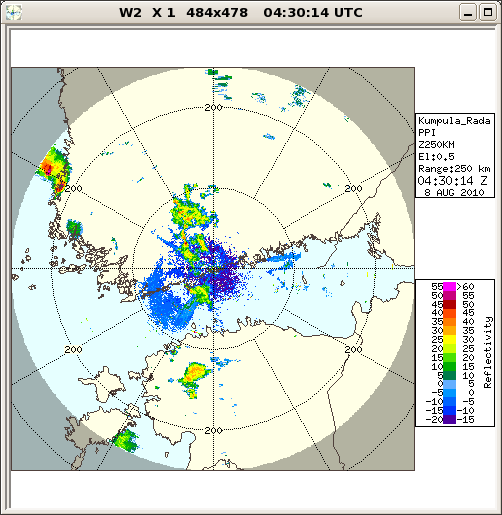
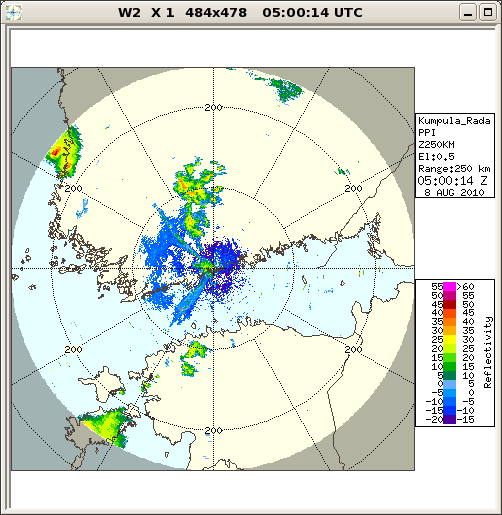
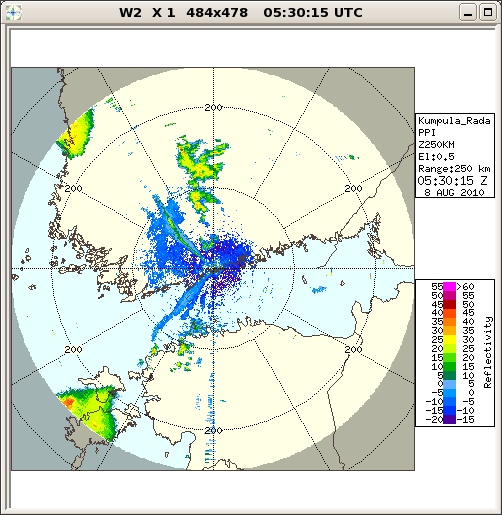
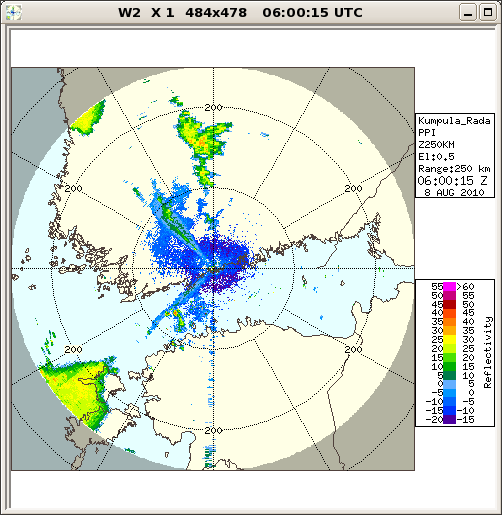
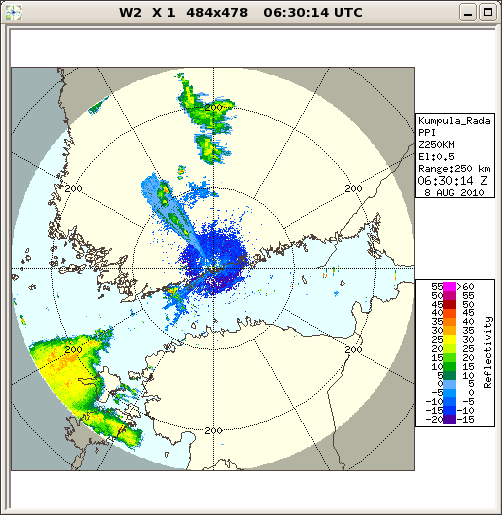
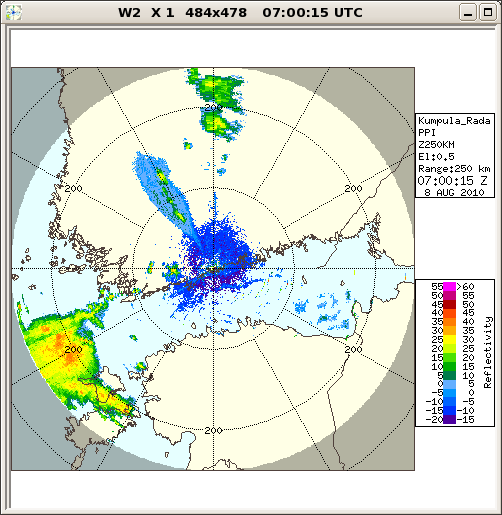
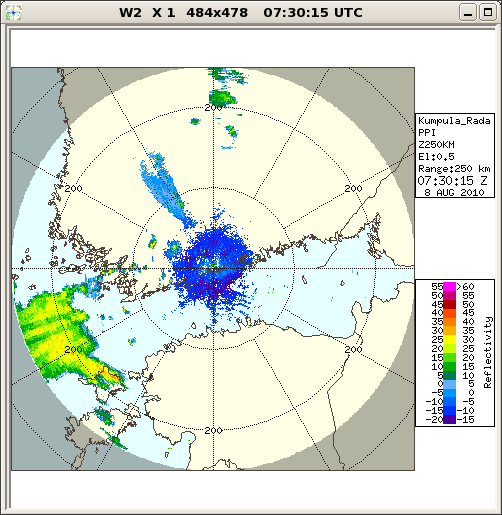
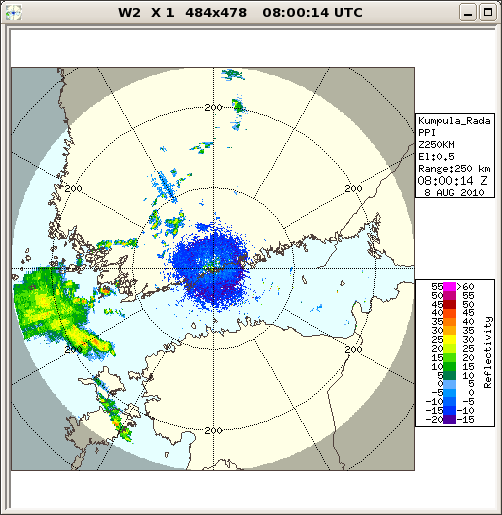
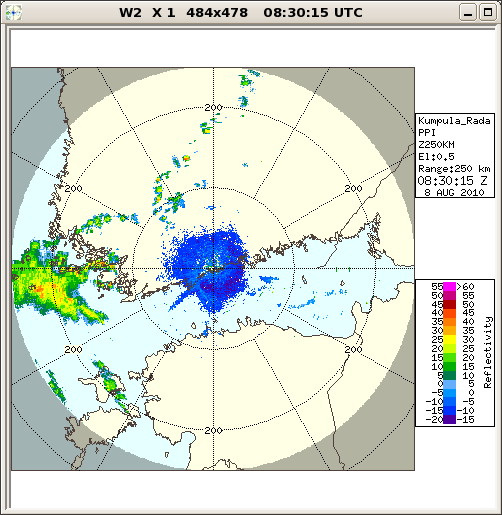
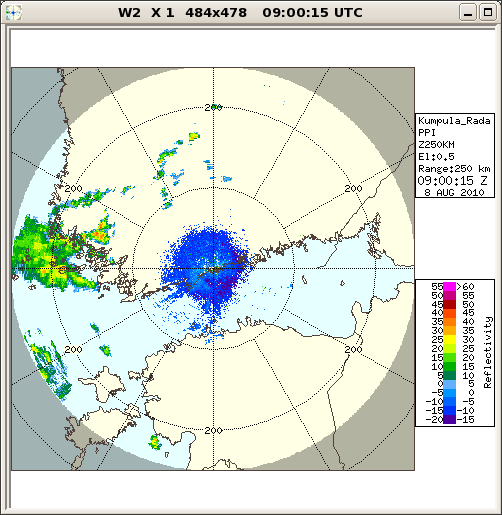
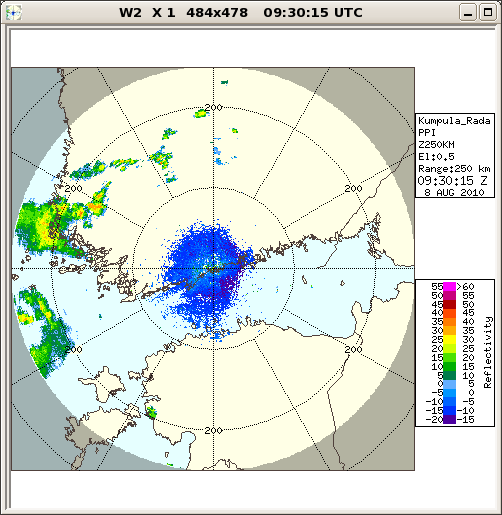
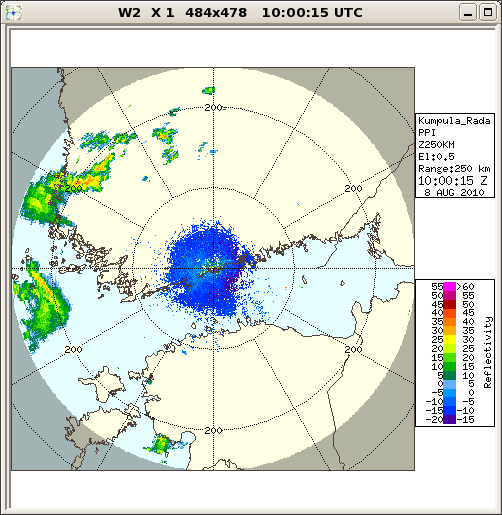
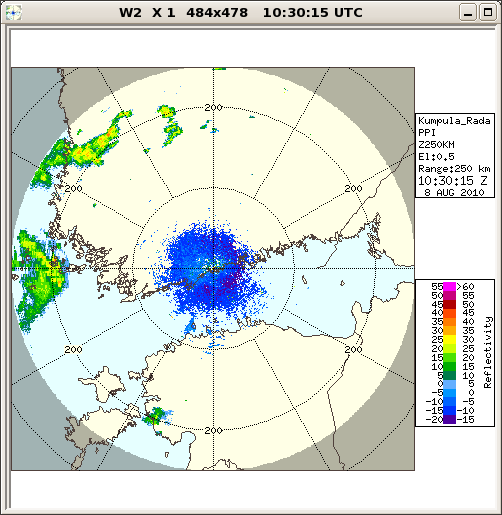
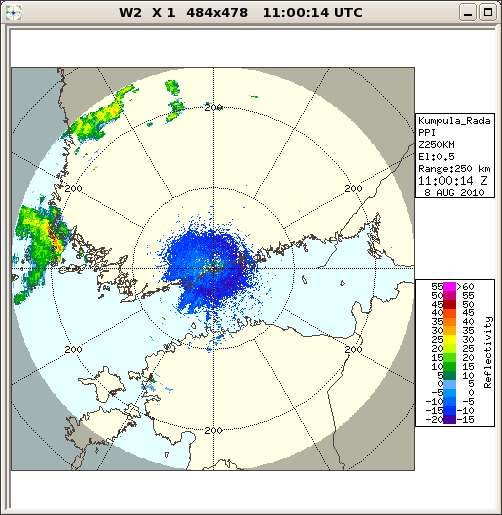
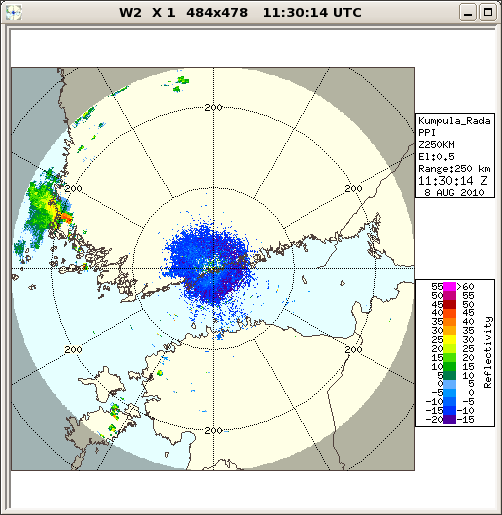
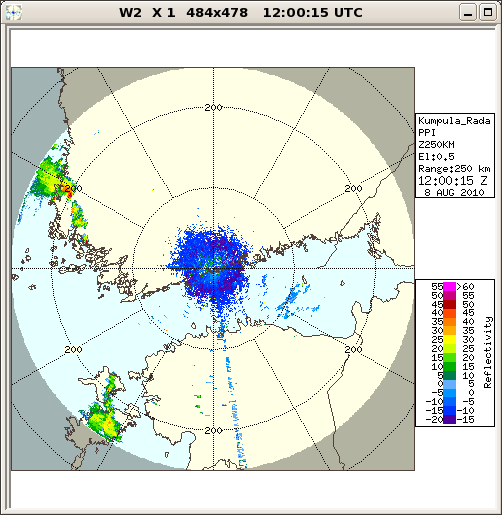
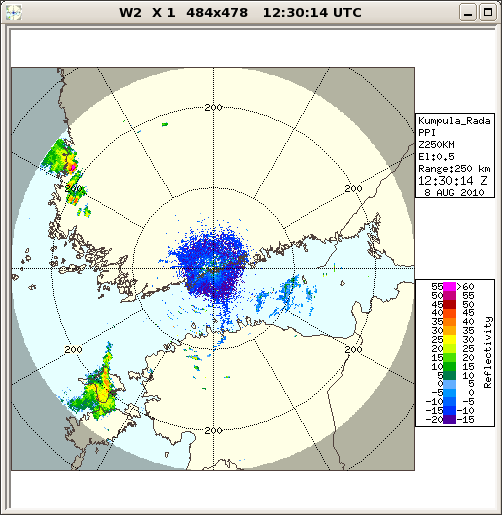
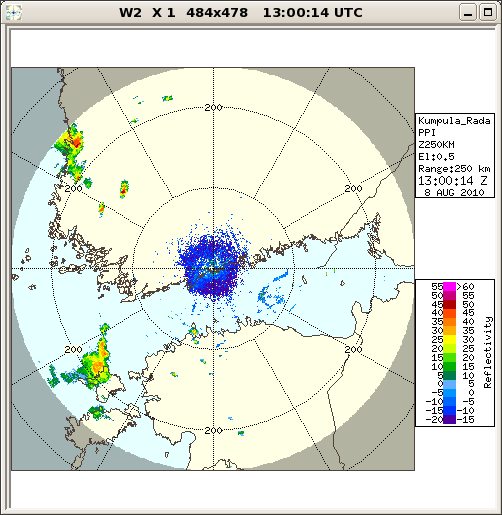
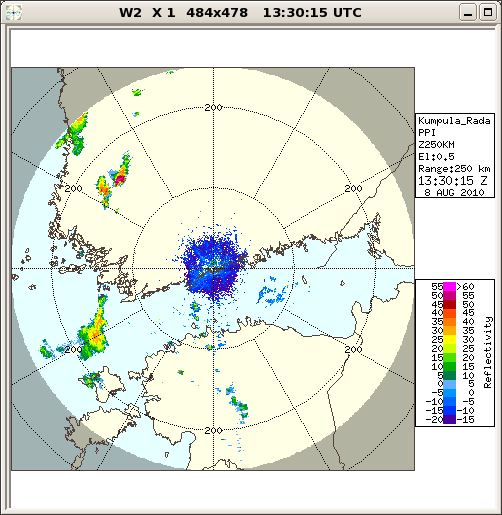
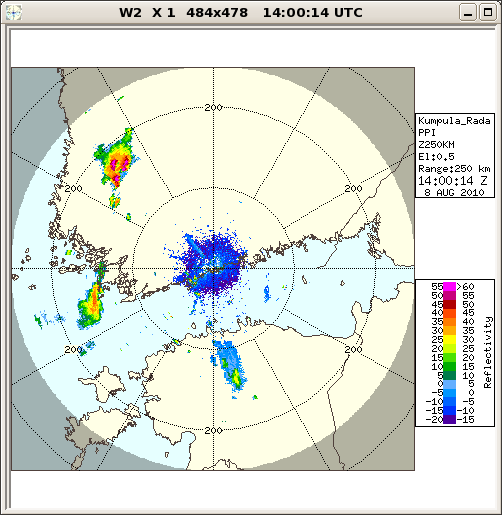
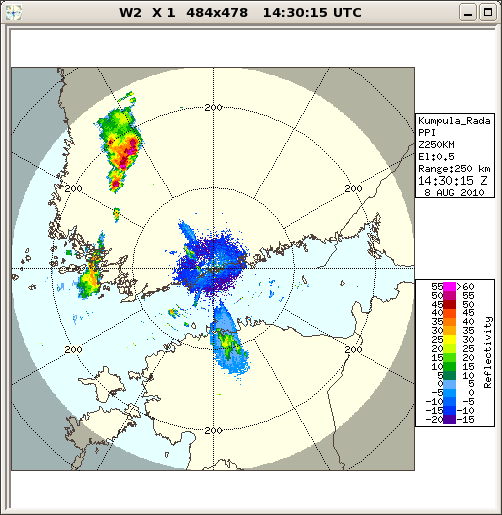
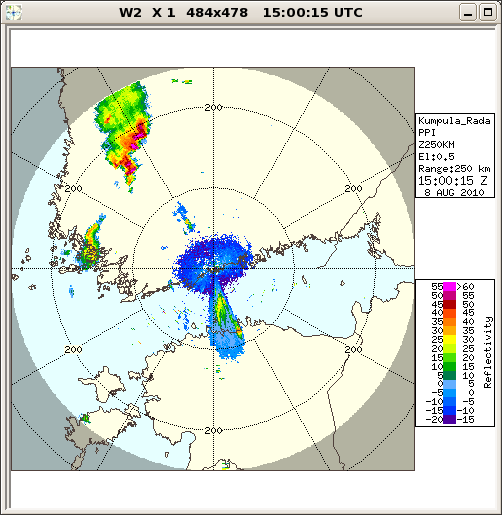
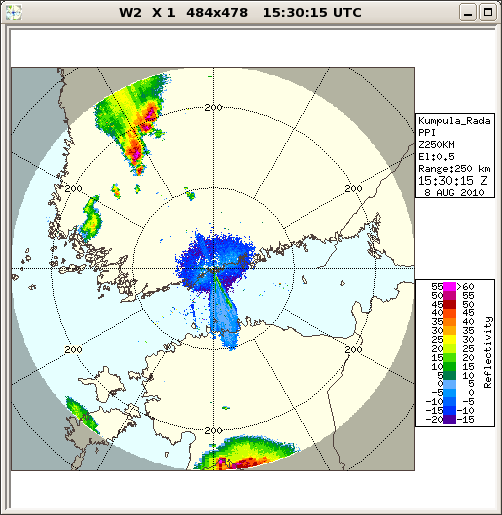
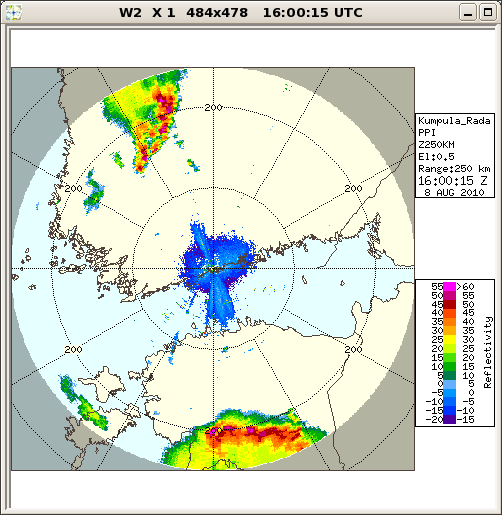
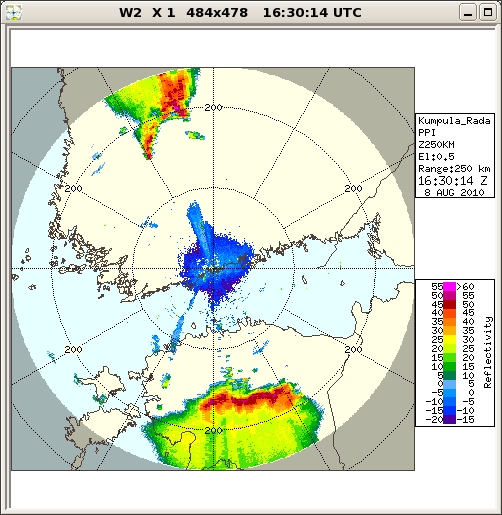
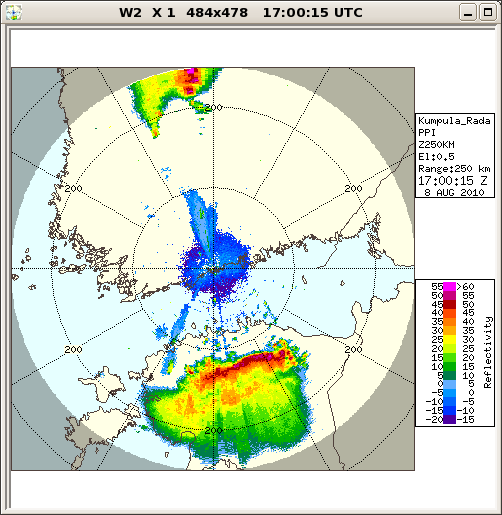
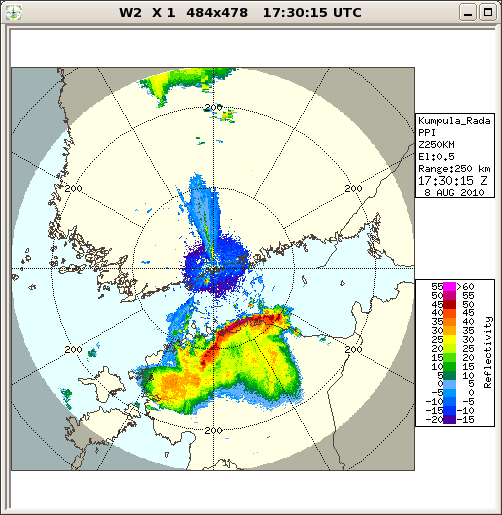
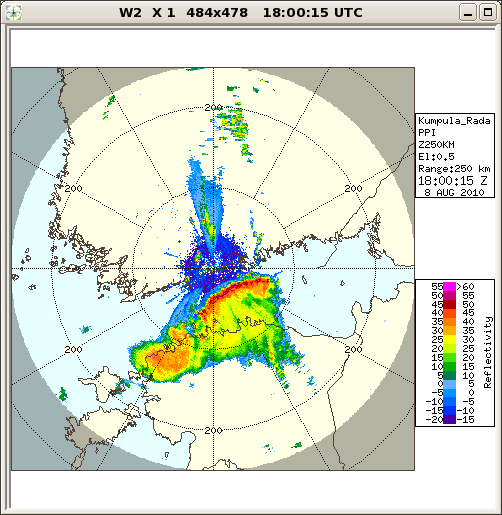
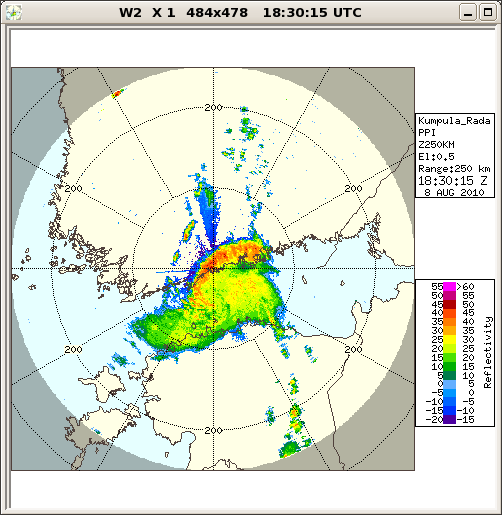
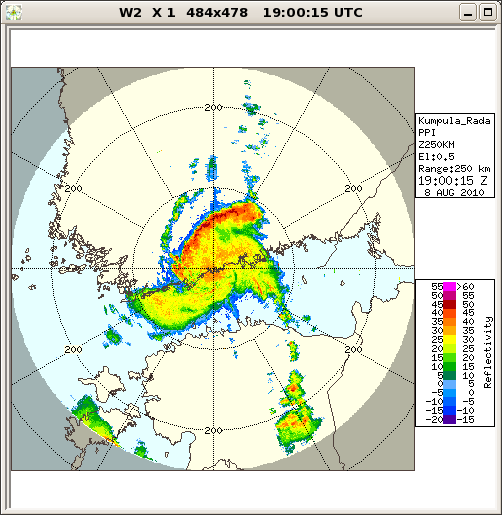
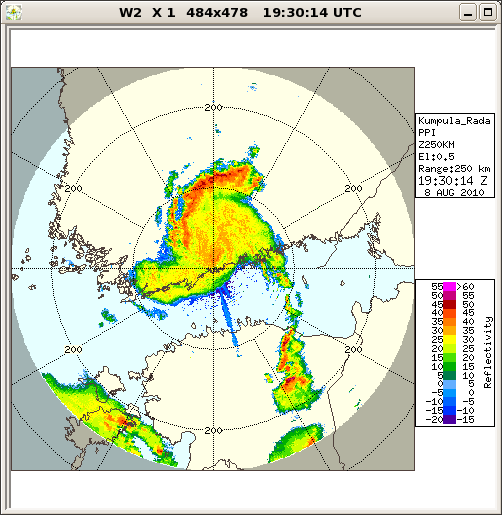
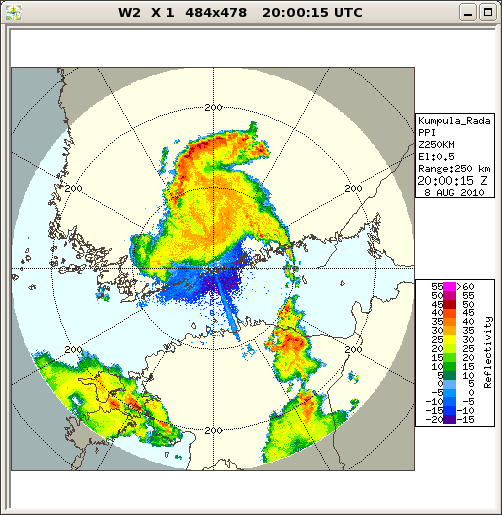
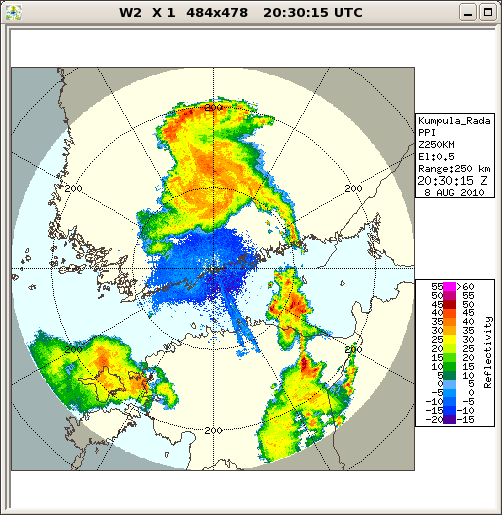
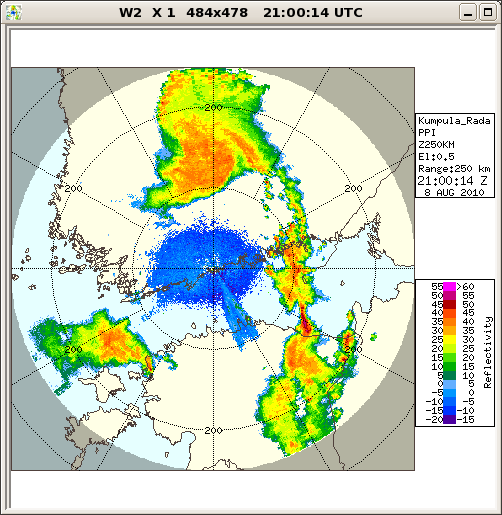
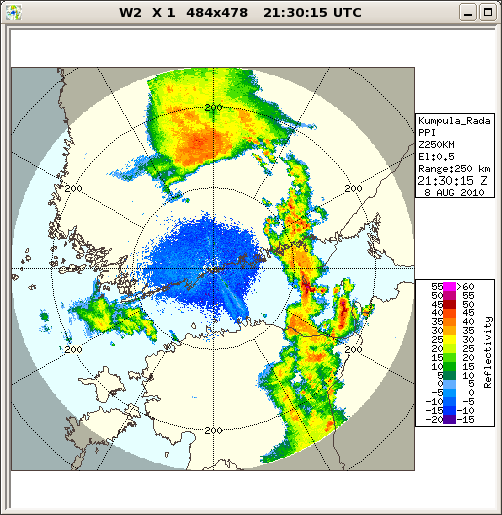
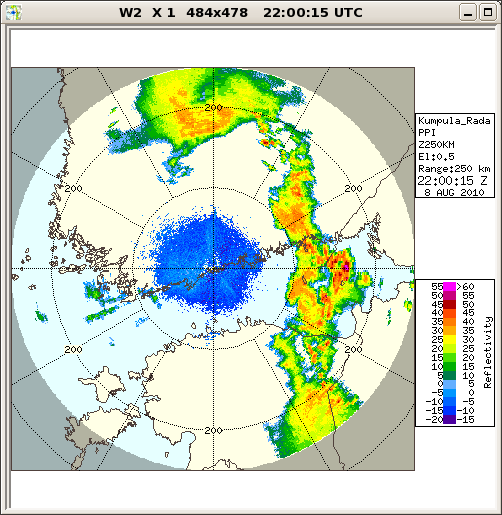
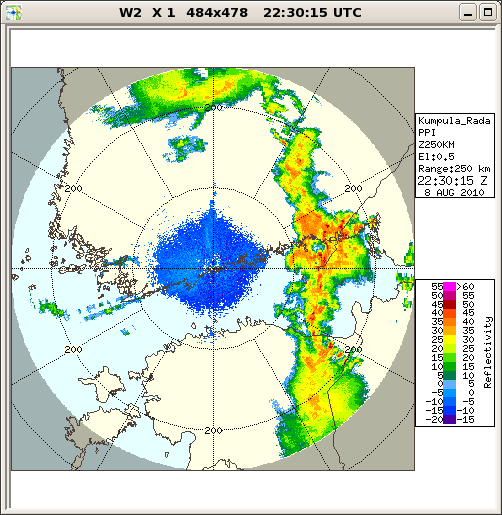
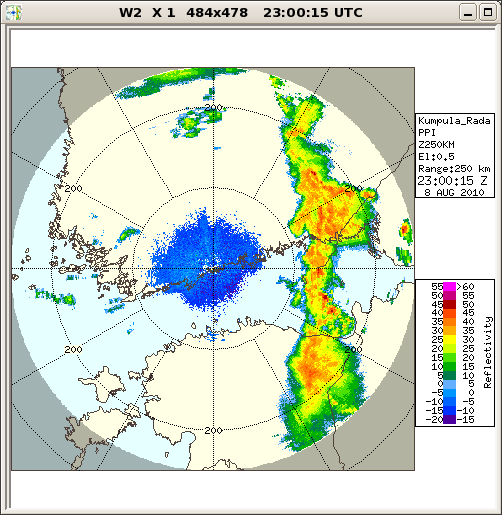
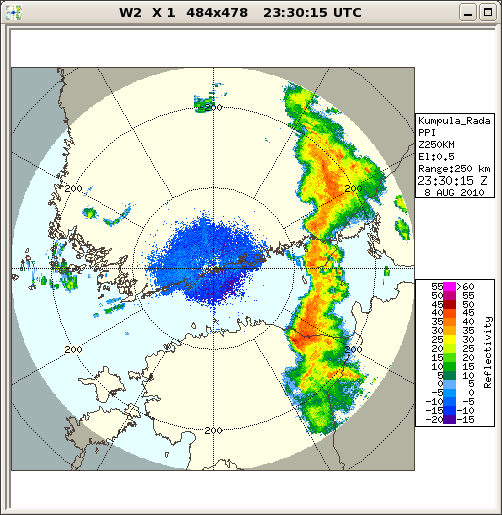
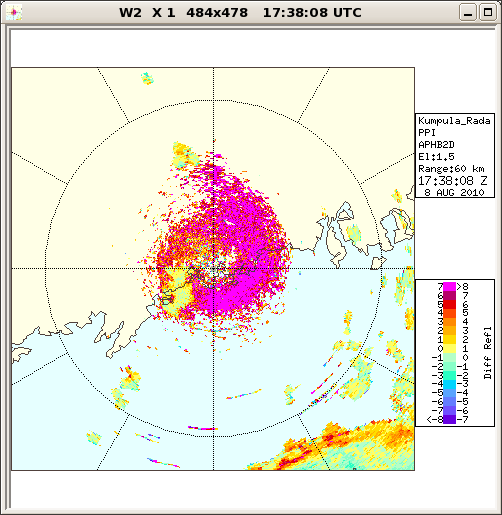
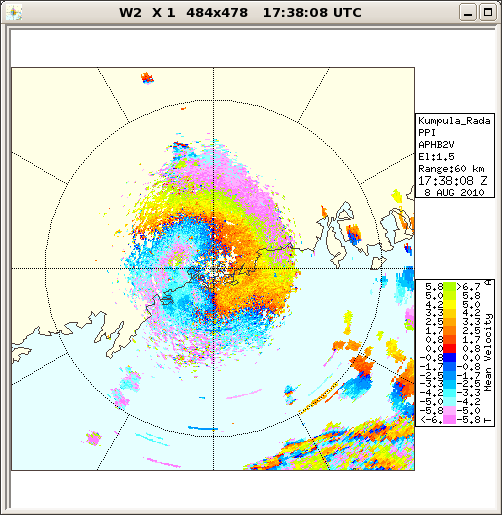
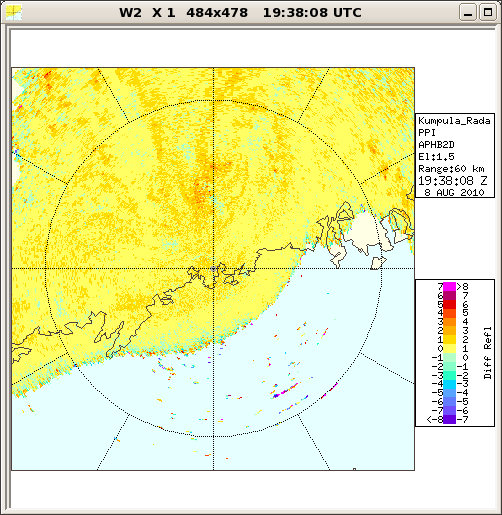
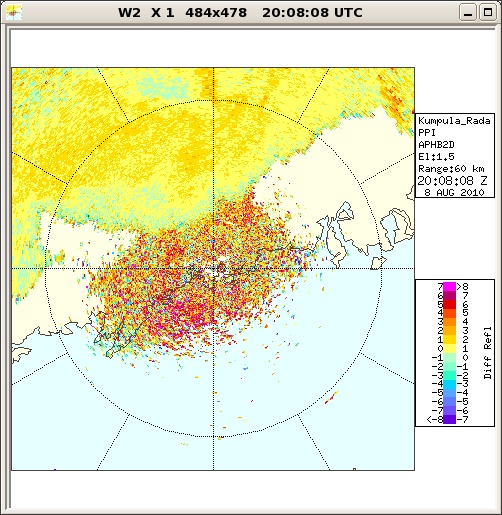
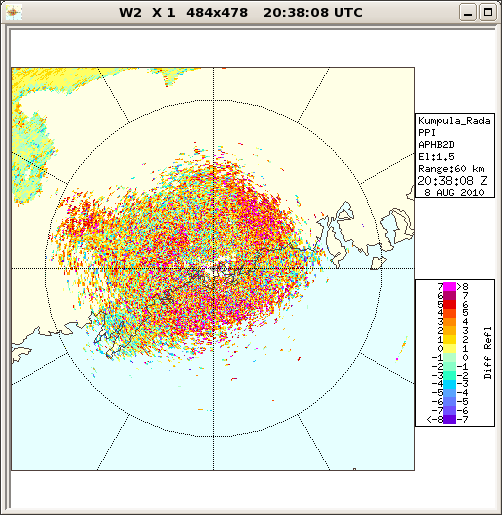
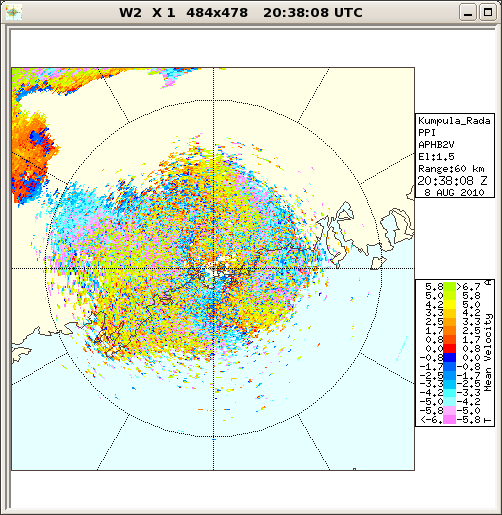
Kumpula radar reflectivity PPIs
Second trip echoes (echoes from the previous transmitted pulse) occurred,
otherwise the weak echoes were related mostly to insects in the air.
Some arc shaped structures caused by the weak antenna sidde lobes can be
spotted.
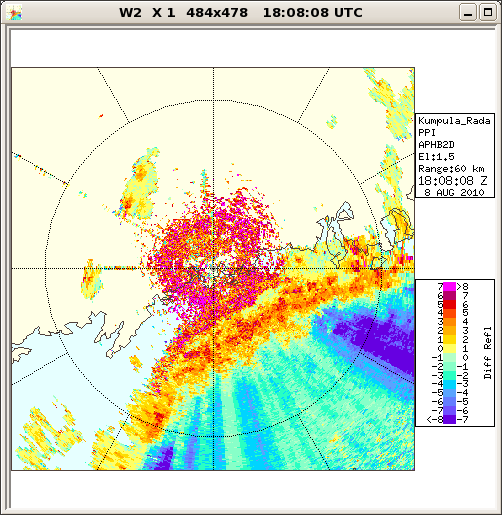
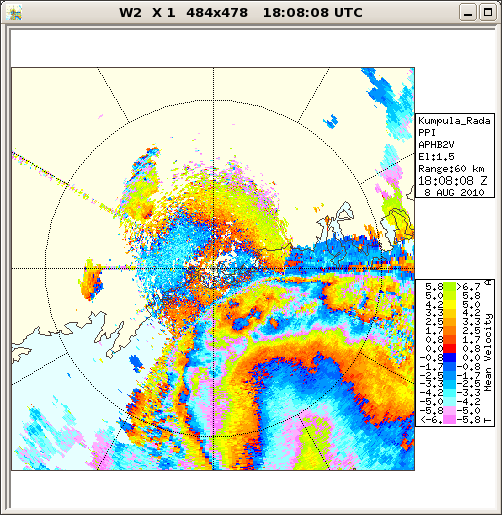
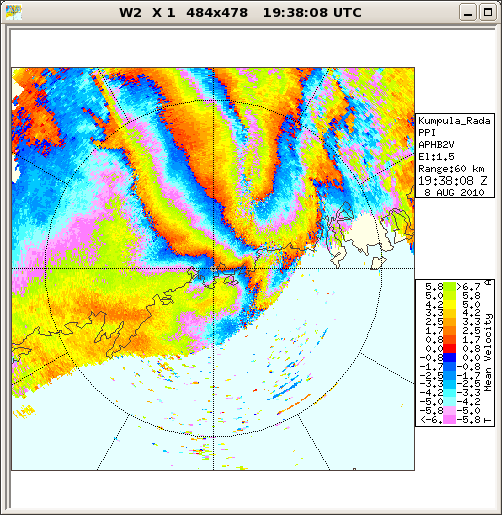
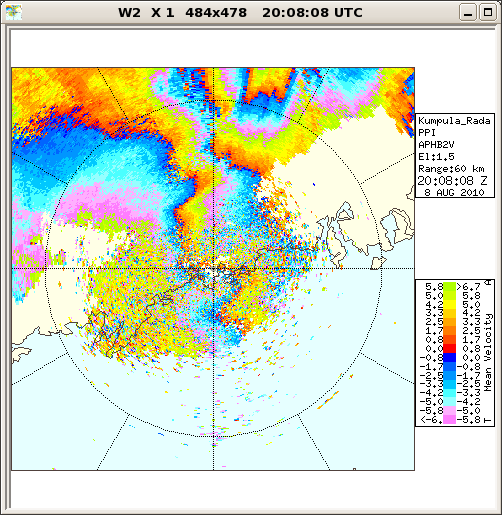
Kumpula radar PPIs
Järvenpää site = HYL, 31.9 km from Kumpula (KUM).
Kerava radar = KER, 22.1 km from Kumpula.
Hailstorms caused attenuation in the echoes from behind the storms,
and the radial velocity was much aliased in some directions.
Reflectivity
18:07 UTC
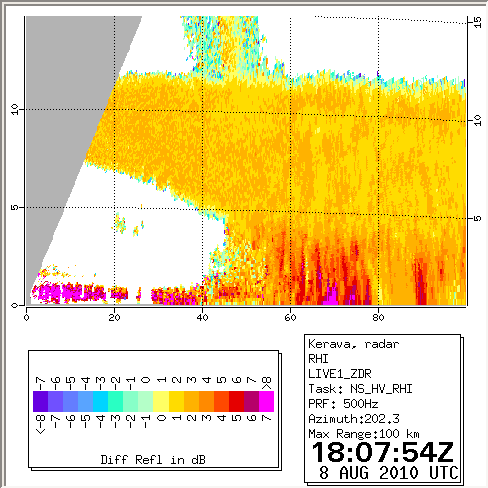
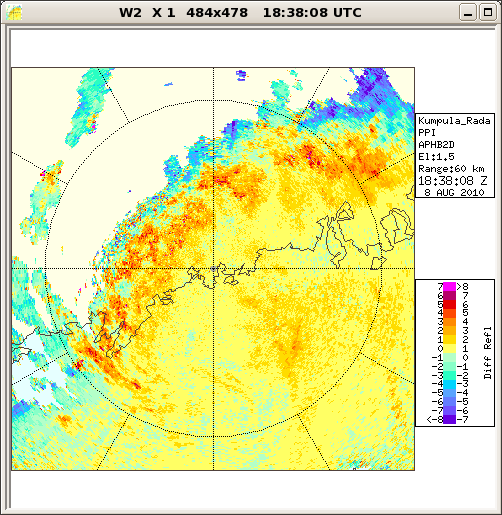
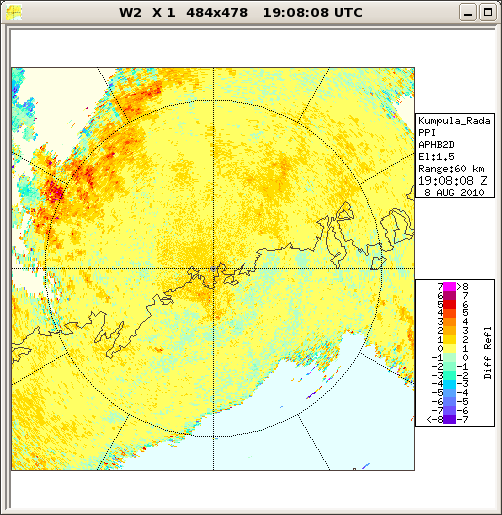
Differential reflectivity
18:07 UTC
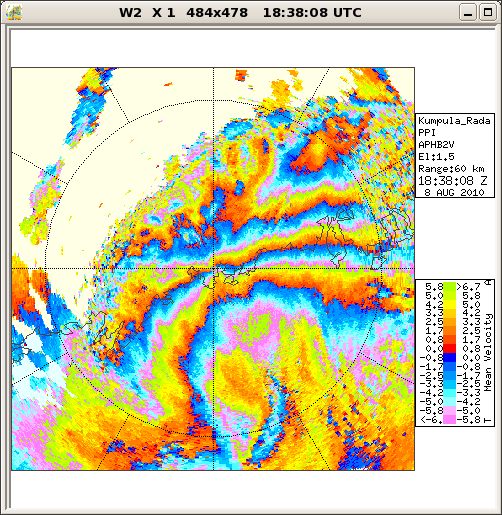
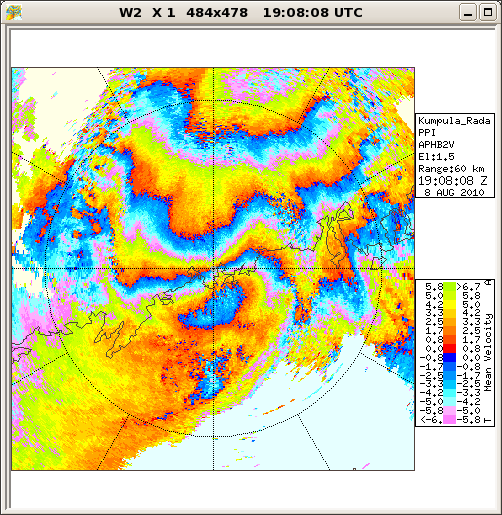
Radial velocity
18:07 UTC
Radial velocity
Dual PRF, 0.7 degrees
18:23 UTC
Radial velocity
Dual PRF, 2.9 degrees
18:24 UTC
Reflectivity
Dual PRF, 0.7 degrees
18:23 UTC
Reflectivity
Dual PRF, 2.9 degrees
18:24 UTC
Reflectivity
18:37 UTC
Differential reflectivity
18:37 UTC
Radial velocity
18:37 UTC
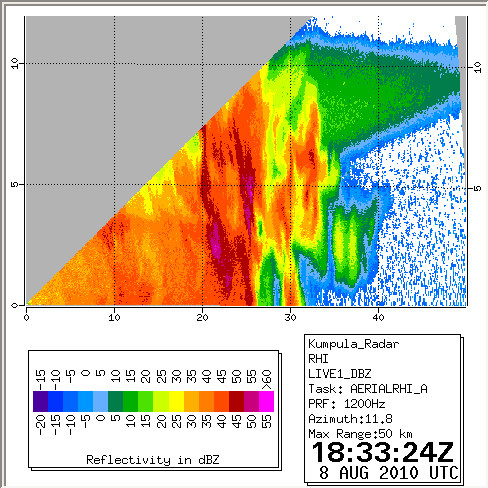
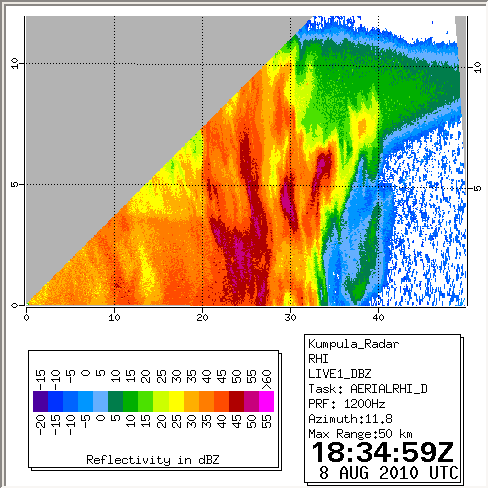
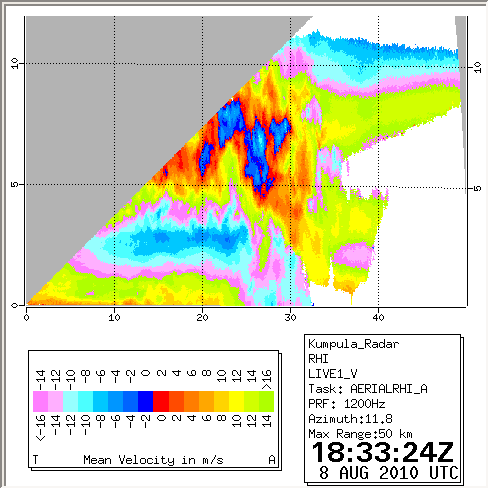
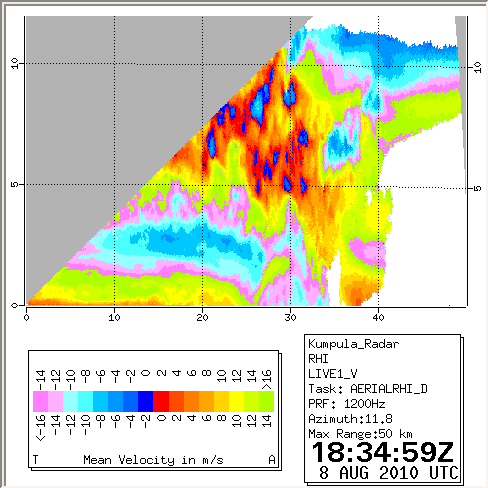
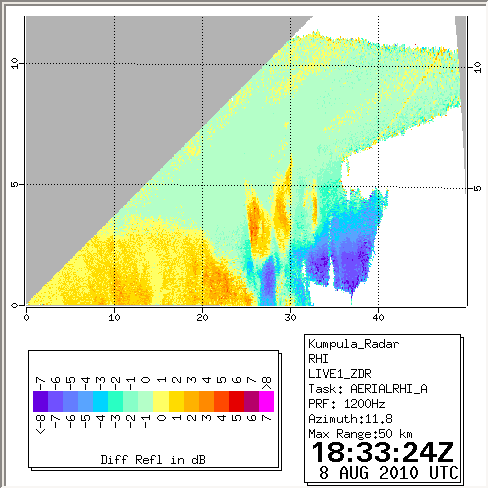
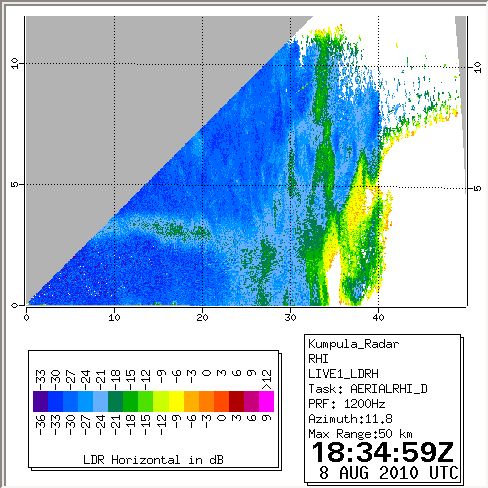
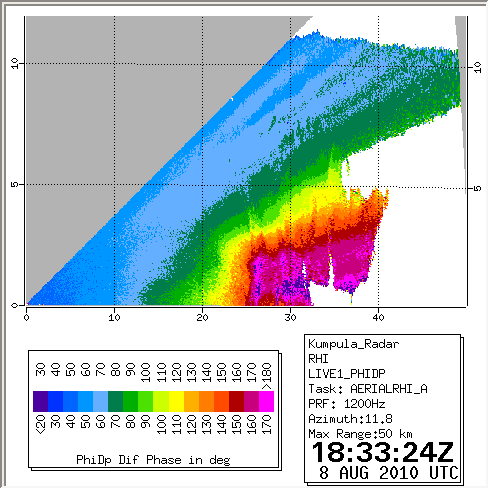
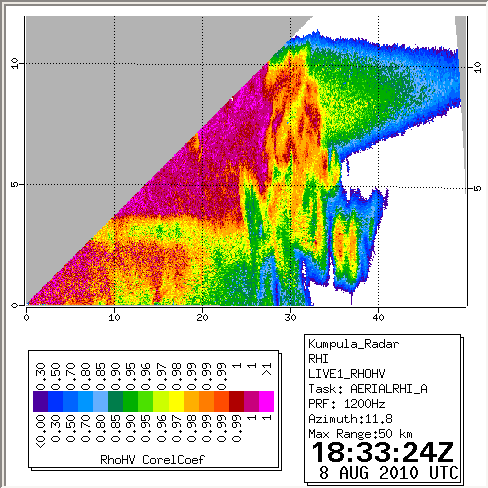
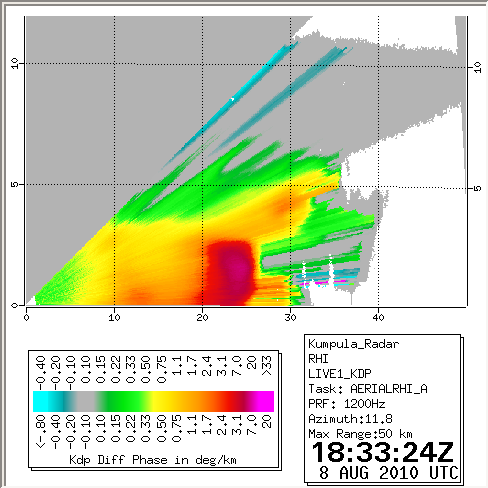
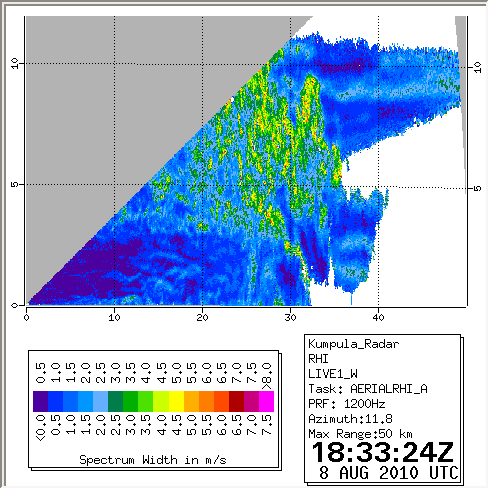
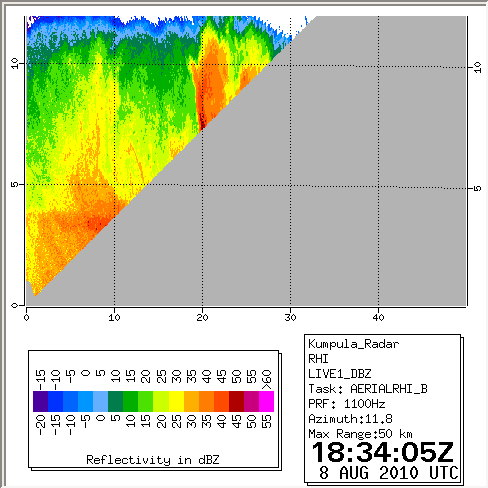
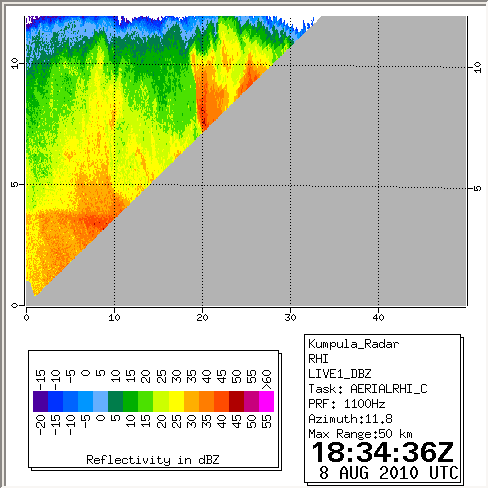
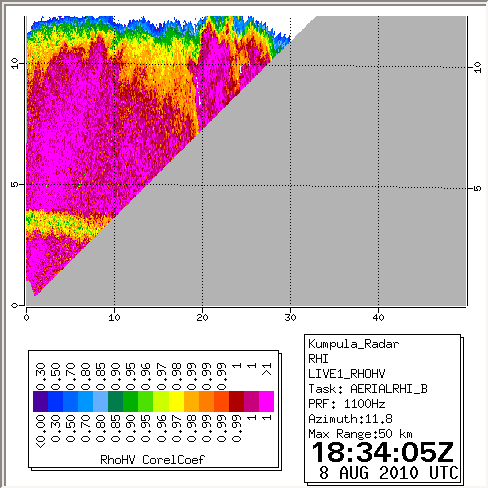
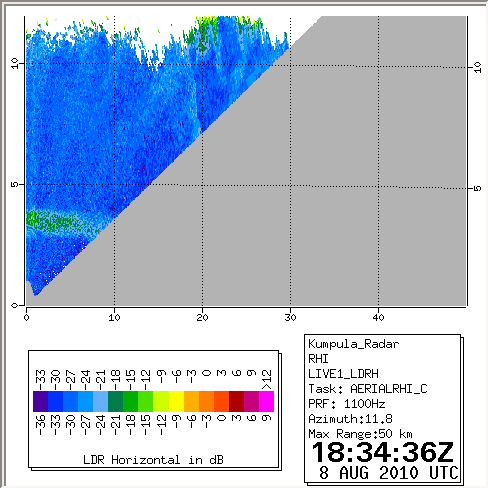
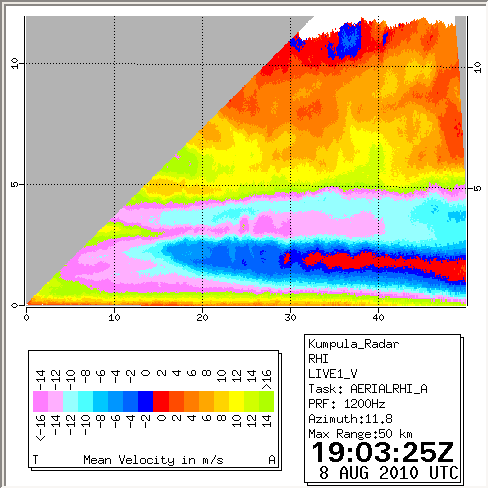
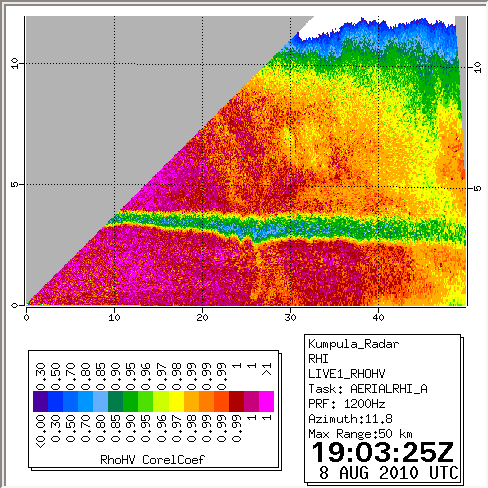
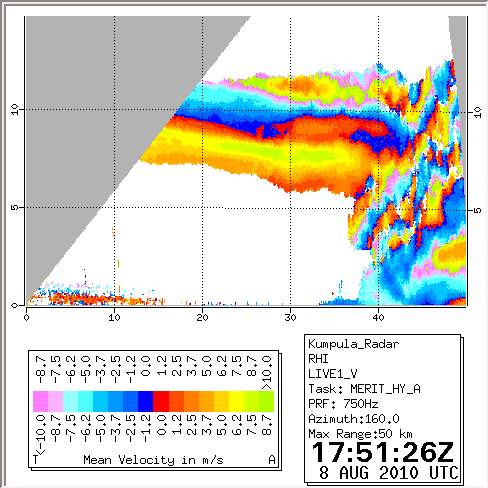
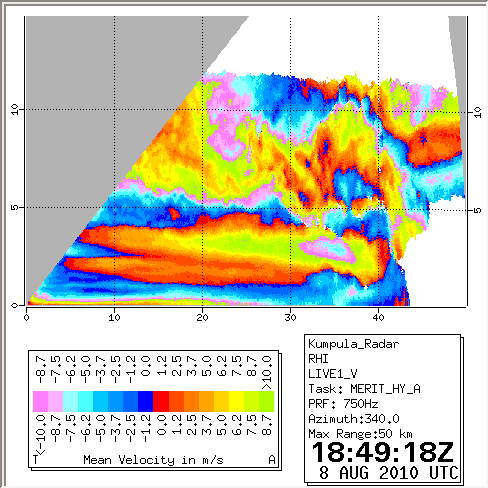
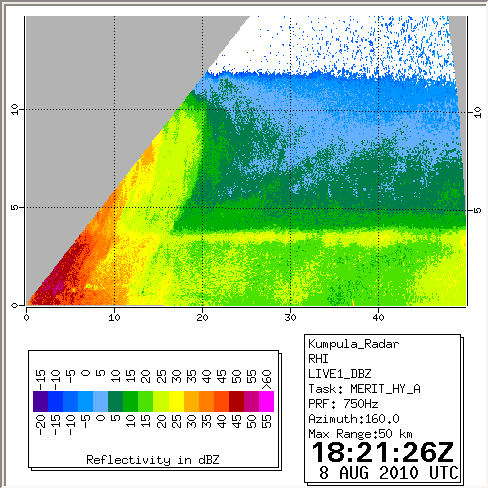
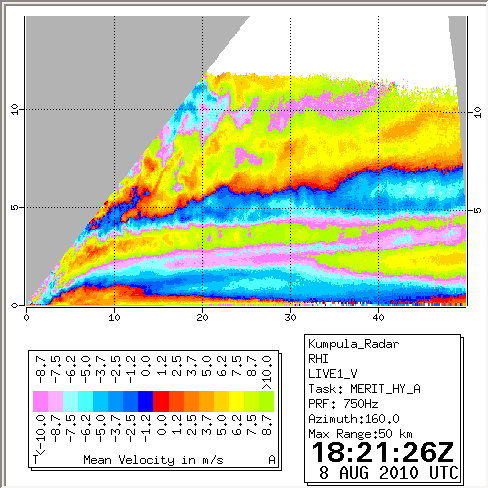
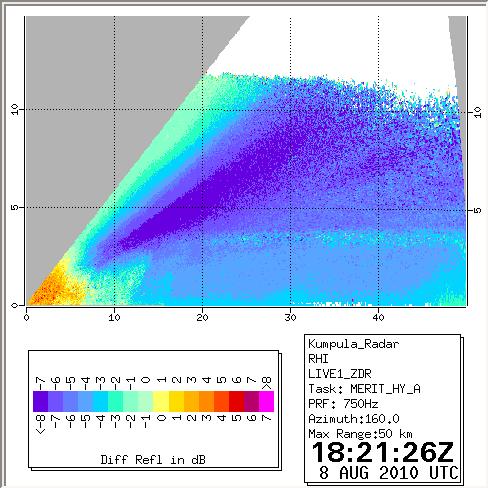
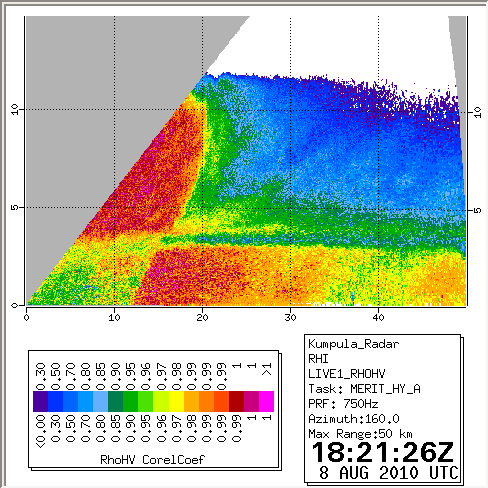
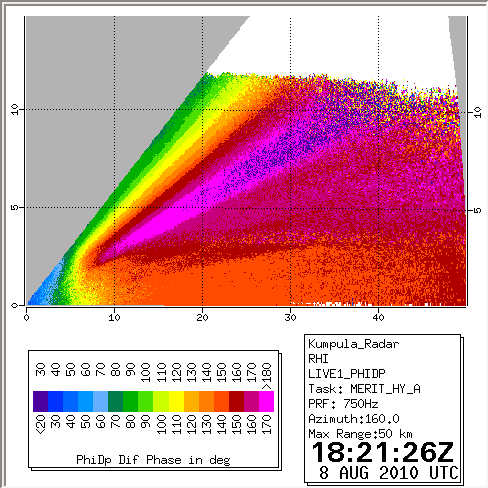
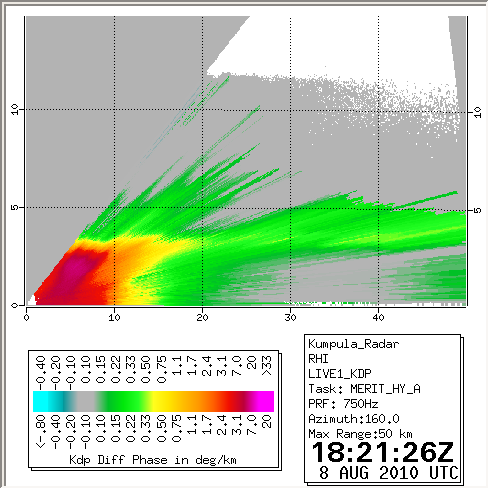
Kumpula vertical cross-sections towards Järvenpää
Vertical cross-sections (RHI images) have distance/km on horizontal and
height/km on vertical axis. Antenna sidelobe echoes of hail are present, and
cause some structures overshooting the real cloud top.
At 18:33 UTC.
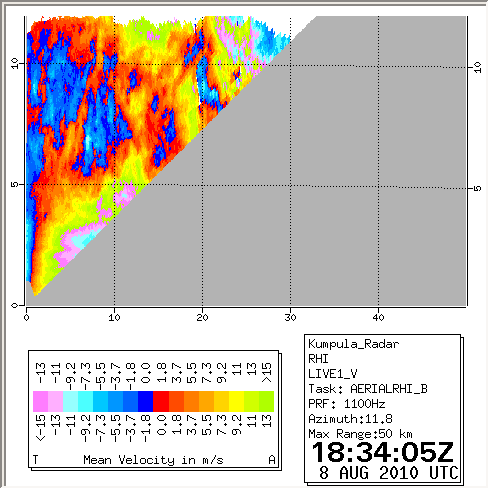
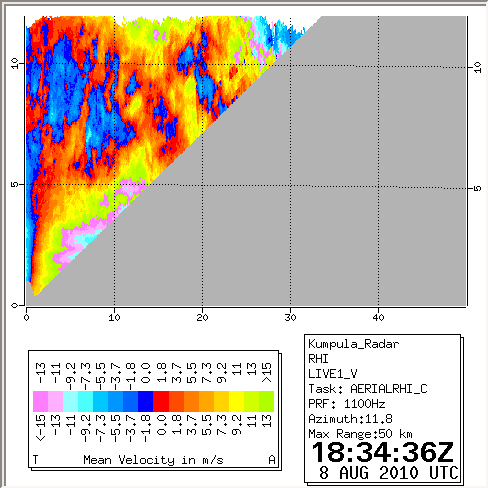
The radial speed near the surface away from the radar was above 16 m/s
at 25 to 32 km distance with maximum about 25 m/s. This area covers
the Centre of Järvenpää, and something south of it in Tuusula.
The highest radial speeds of about 30 m/s were observed at about 3 km
altitude. Above 3 km radial speeds were lower, and above 5 km even towards
the radar, and again stronger away from the radar above 9 km, and ahead of
the area where the precipitation was reaching the surface.
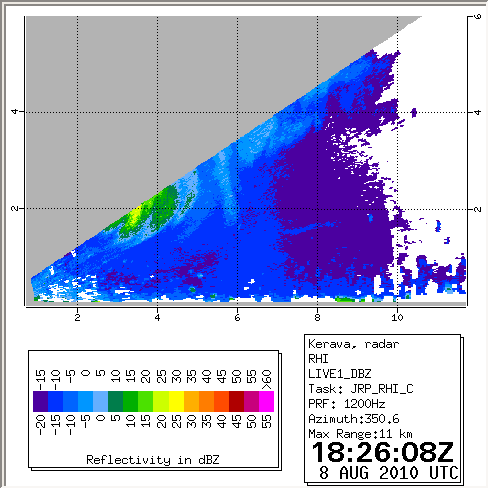
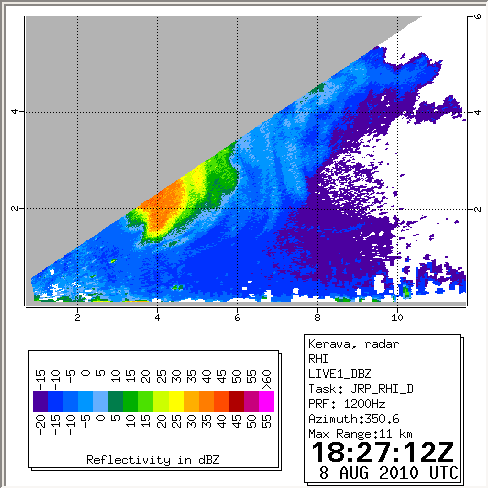
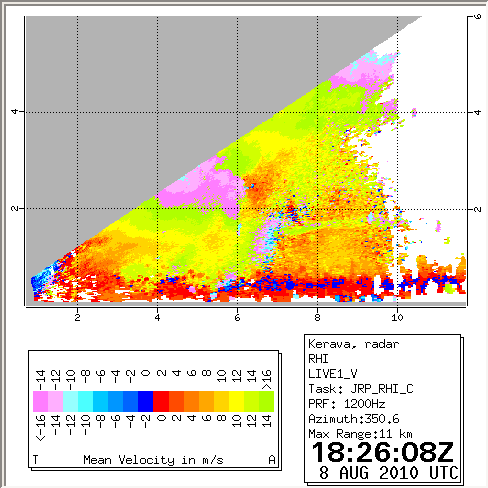
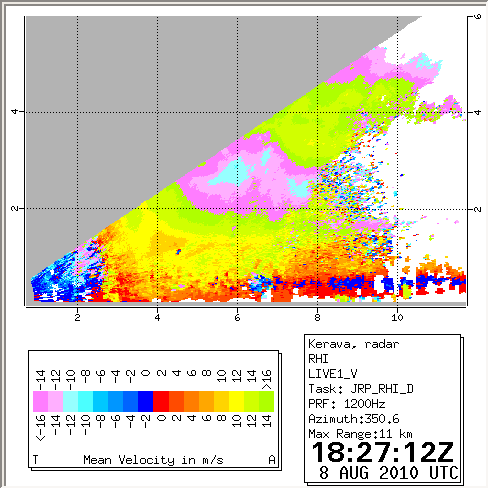
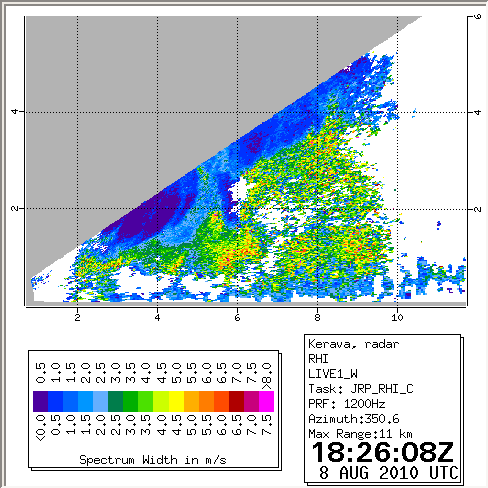
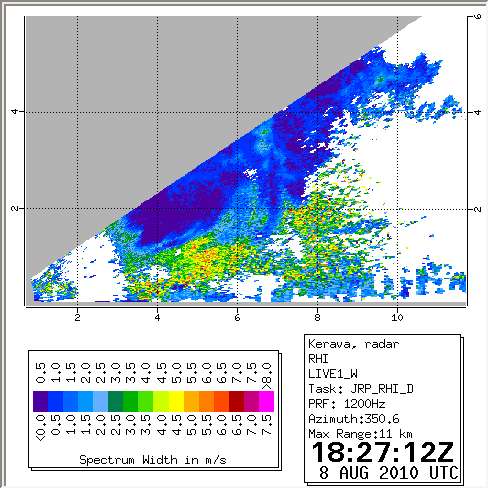
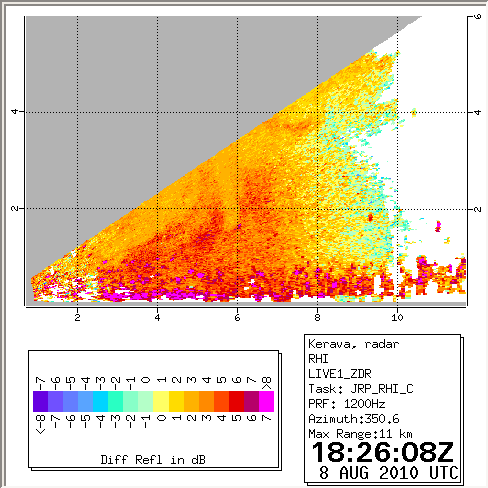
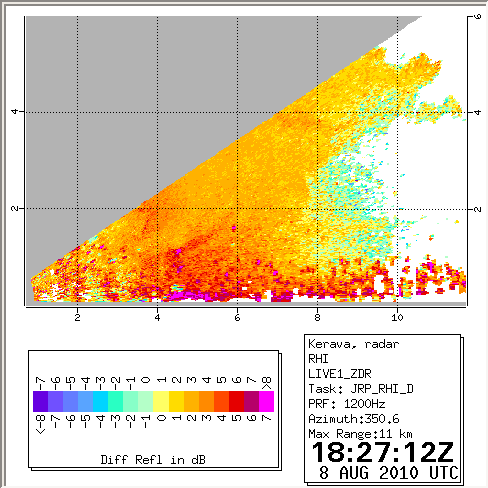
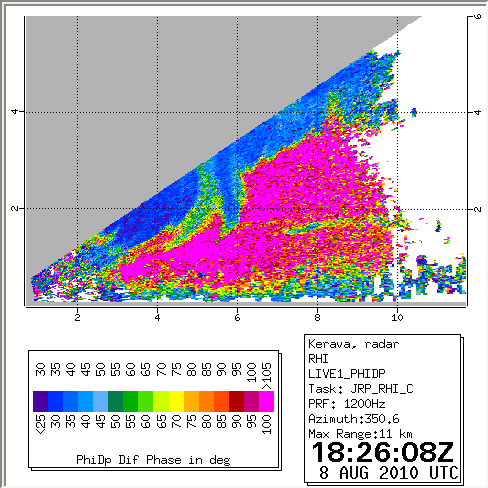
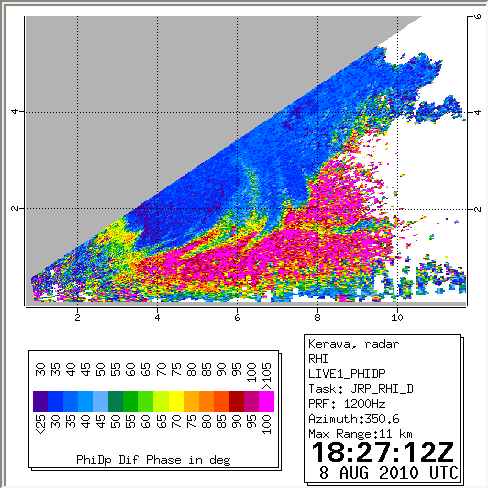
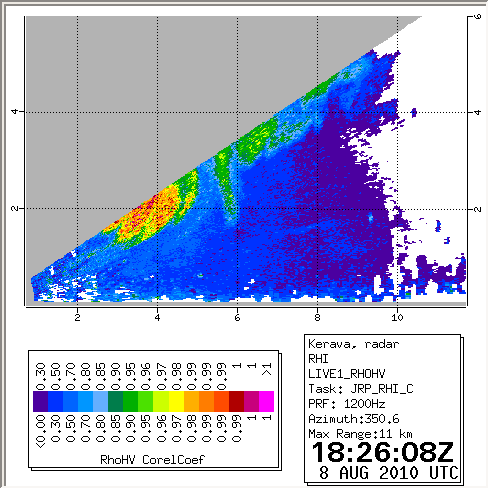
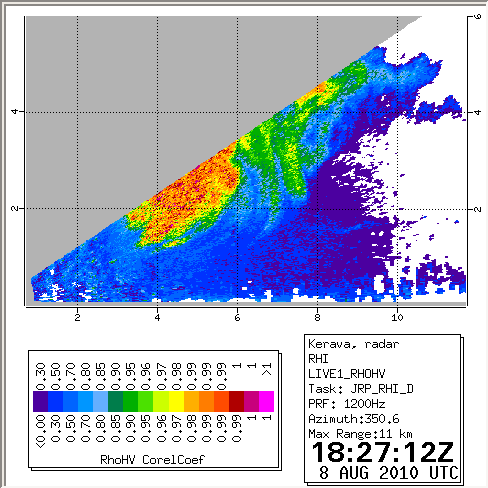
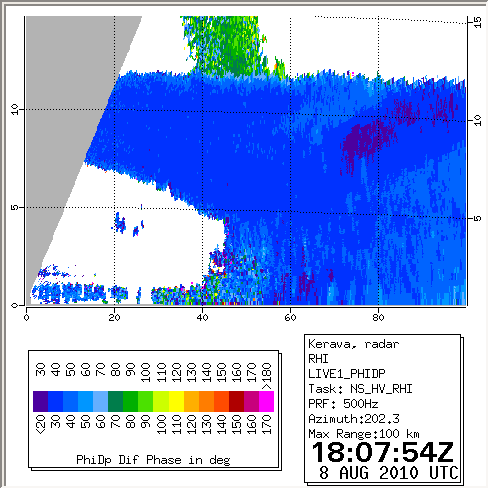
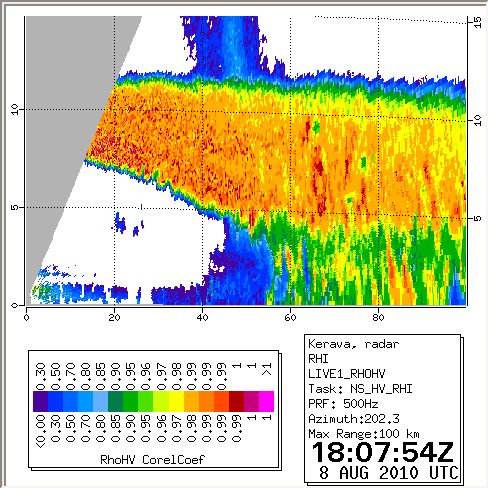
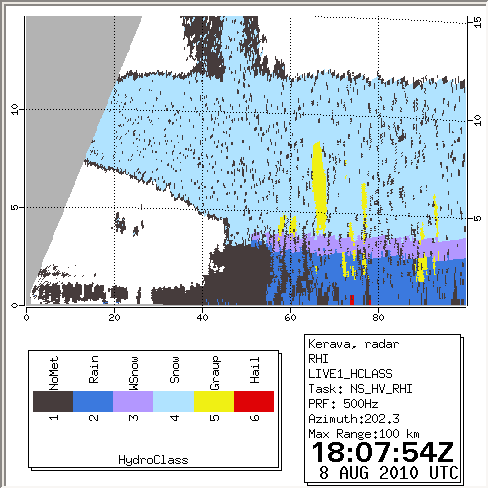
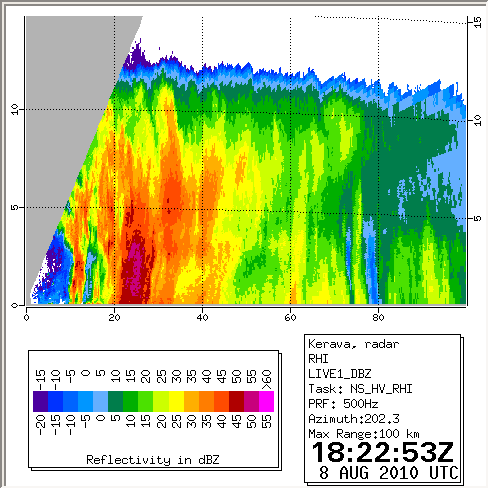
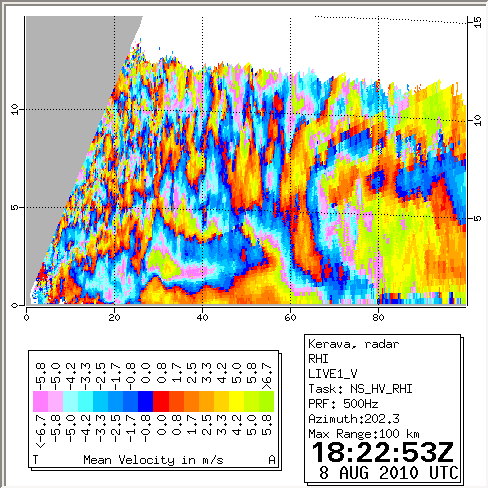
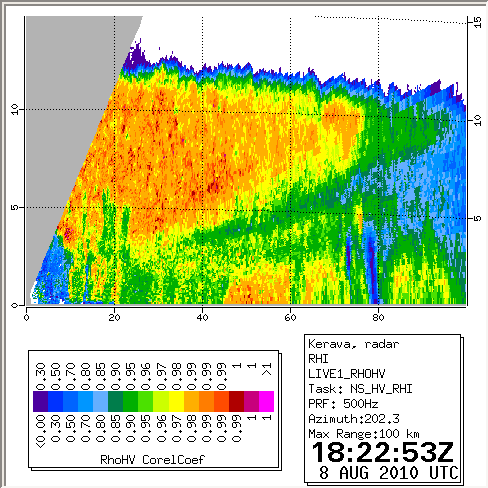
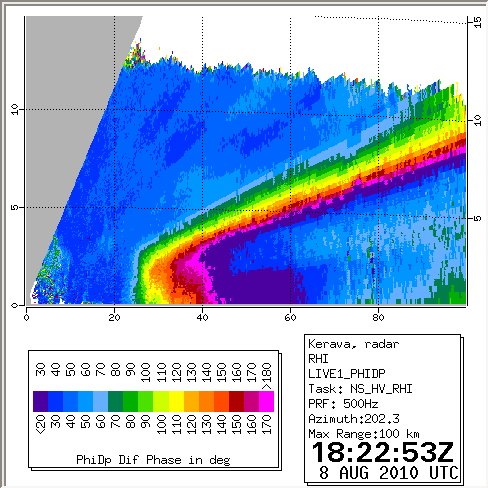
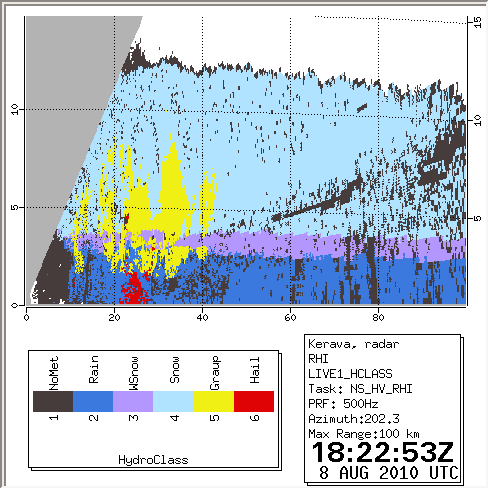
Kerava vertical cross-sections towards Järvenpää
Distance to Järvenpää site is 10.9 km.
Last data from Kerava received in Kumpula was from the 18:27 UTC RHI.
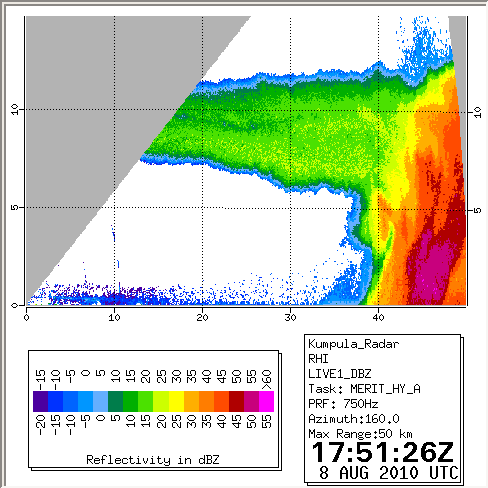
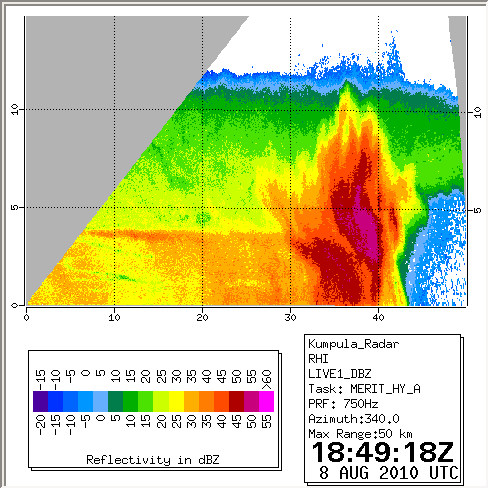
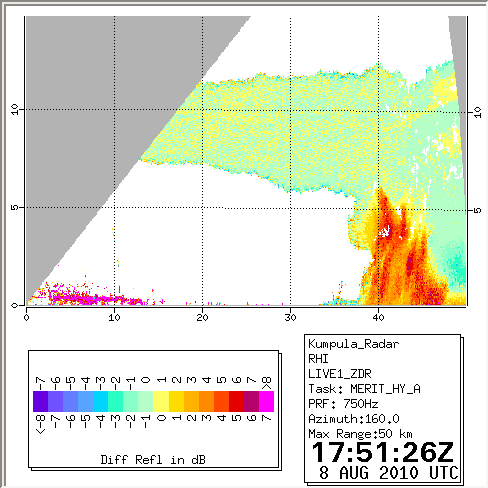
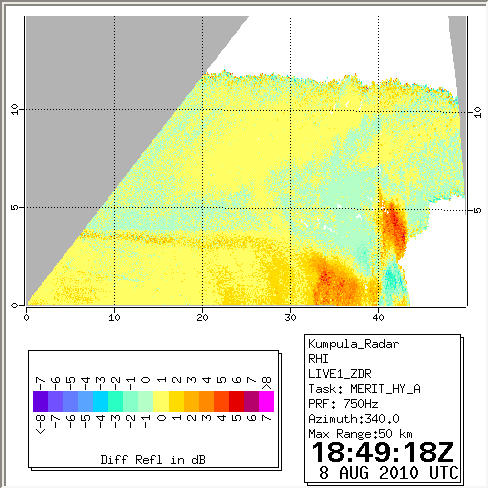
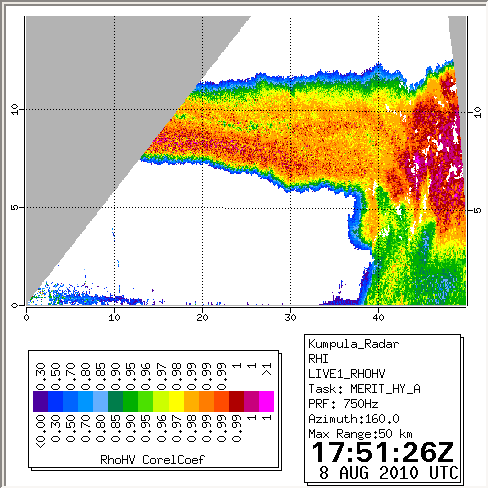
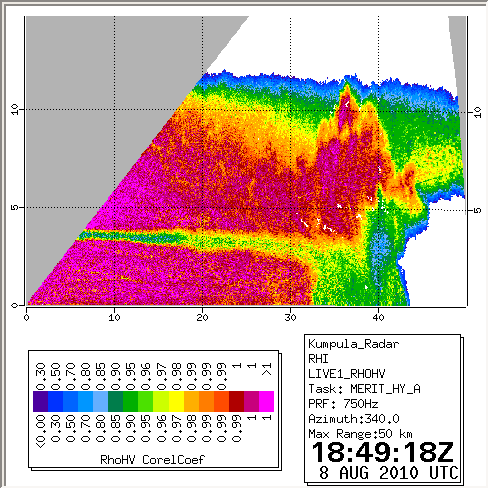
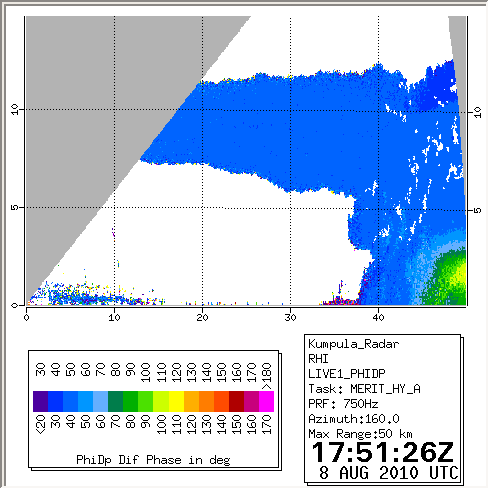
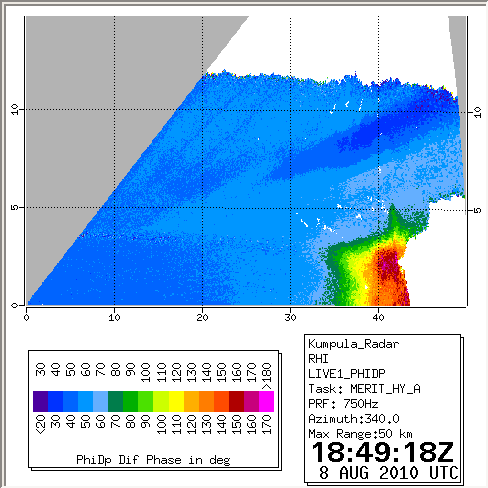
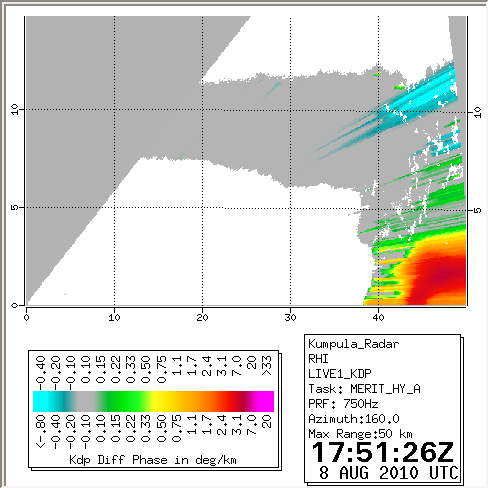
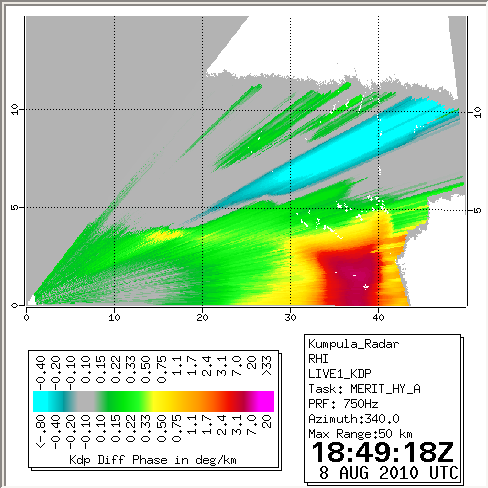
Other vertical cross-sections
Kumpula RHIs before and after the storm was over Helsinki
At 17:51 UTC the azimuth is 160 degrees (SSE), at 18:49 UTC 340 degrees
(NNW).
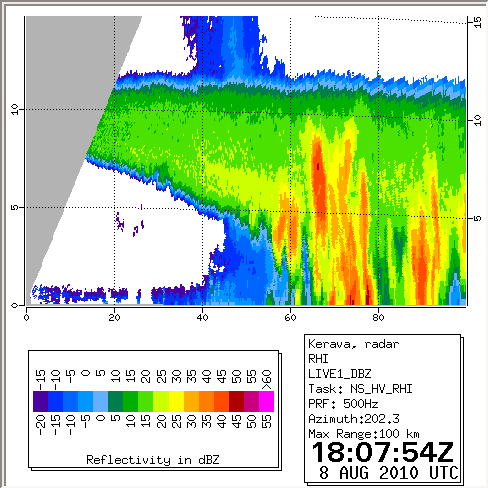
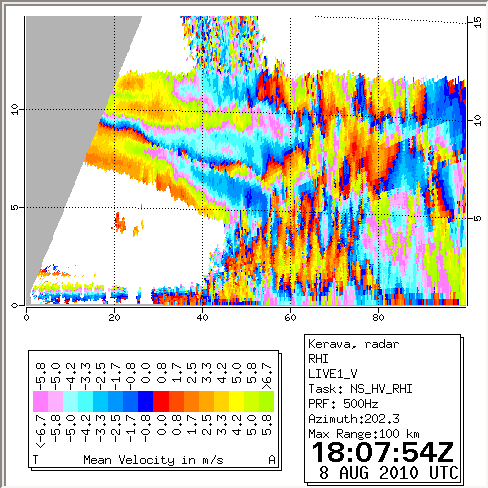
Kerava RHIs before the storm was over Helsinki
The vertical cross-section towards SSW, Kumpula radar at 22.1 km distance.
Kumpula and Kerava RHIs at the time the storm gets over Helsinki
The Kumpula vertical cross-section towards SSE, perpendicular to the
coast, and the Kerava vertical cross-section towards SSW (Kumpula radar
at 22.1 km distance).
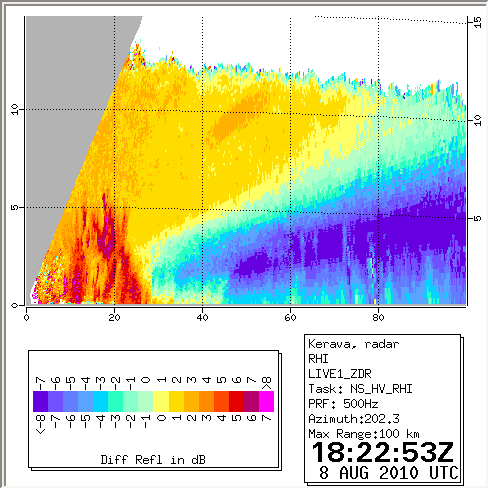
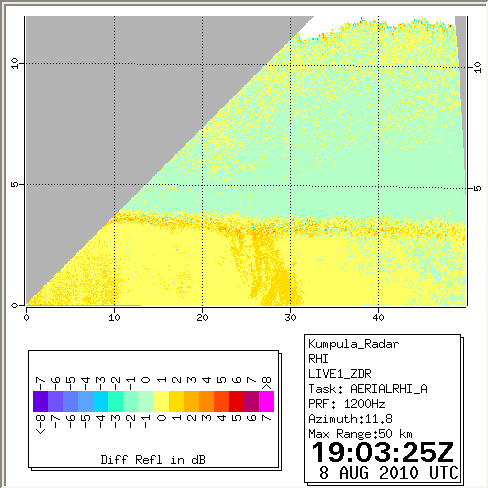
Differential reflectivity and radial velocity
Elevation angle of 1.5 degrees, about 1 km height at 40 km distance.
Before and after the precipitation a lot of insects were coming
from WSW-SSW, during precipitation the flow was much stronger from SSE.
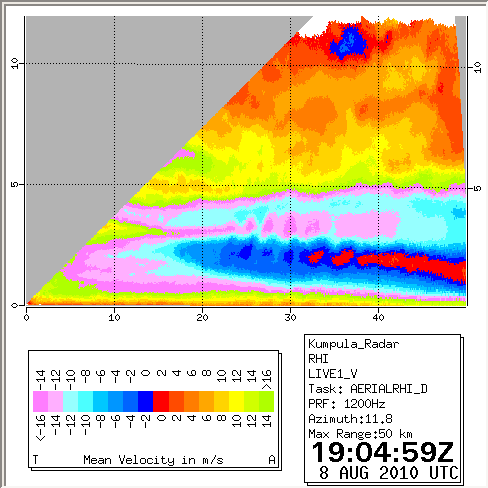
Järvenpää radar images
Radial velocity
19:00 UTC
75 degrees elevation angle, 14.9 km altitude at 4 km distance.
Maximum radial speed is about 17 m/s at about 2 km height SSE of
the radar, and notice that much fall speed is included.
Radial velocity
19:02 UTC
30 degrees elevation angle, 2.3 km altitude at 4 km distance.
Maximum radial speed is about 37 m/s at about 2 km height SSE from the
radar, and notice that much fall speed is included.
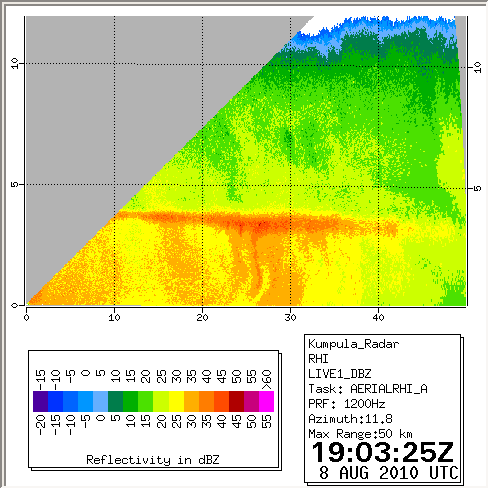
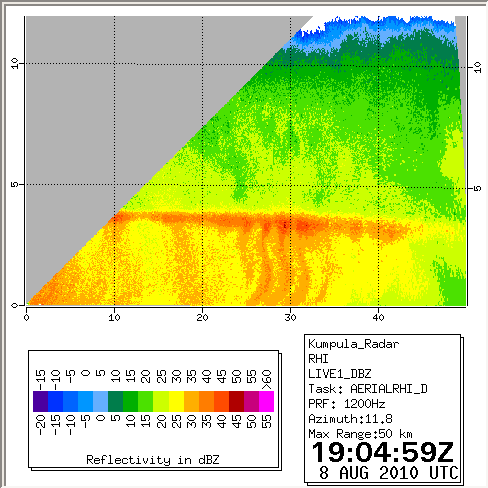
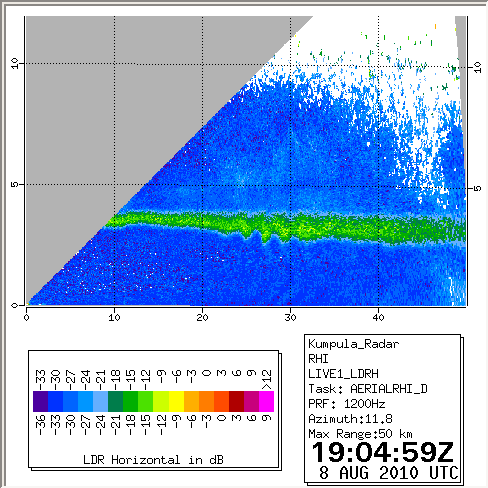
Reflectivity
19:04 UTC
Melting layer at about 3.5 km altitude, close range reflectivity
is not corrected for the attenuation of the RF limiter.
Radial velocity
19:04 UTC
Maximum average downward speed (fall speed) about 8 m/s. This would mean
radial velocity component of 7.7 m/s at 75 degrees and 4.0 m/s at
30 degrees elevation, about 15 and 8 m/s difference in SSE vs NNW
(azimuths of the maximum radial velocities) in the PPIs.
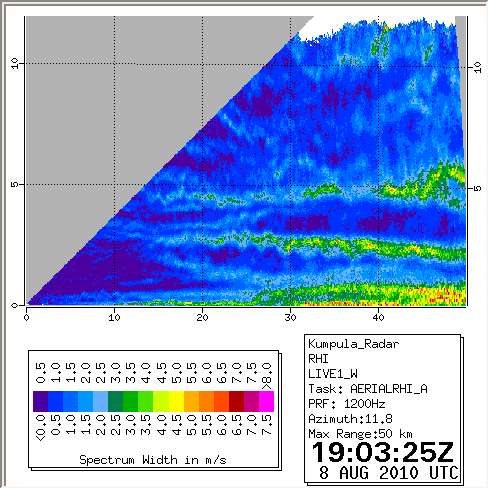
Doppler spectrum width
19:04 UTC
Some turbulent spots, and widening of the Doppler spectra by fall speed
range in rain (or hail) below the melting layer.