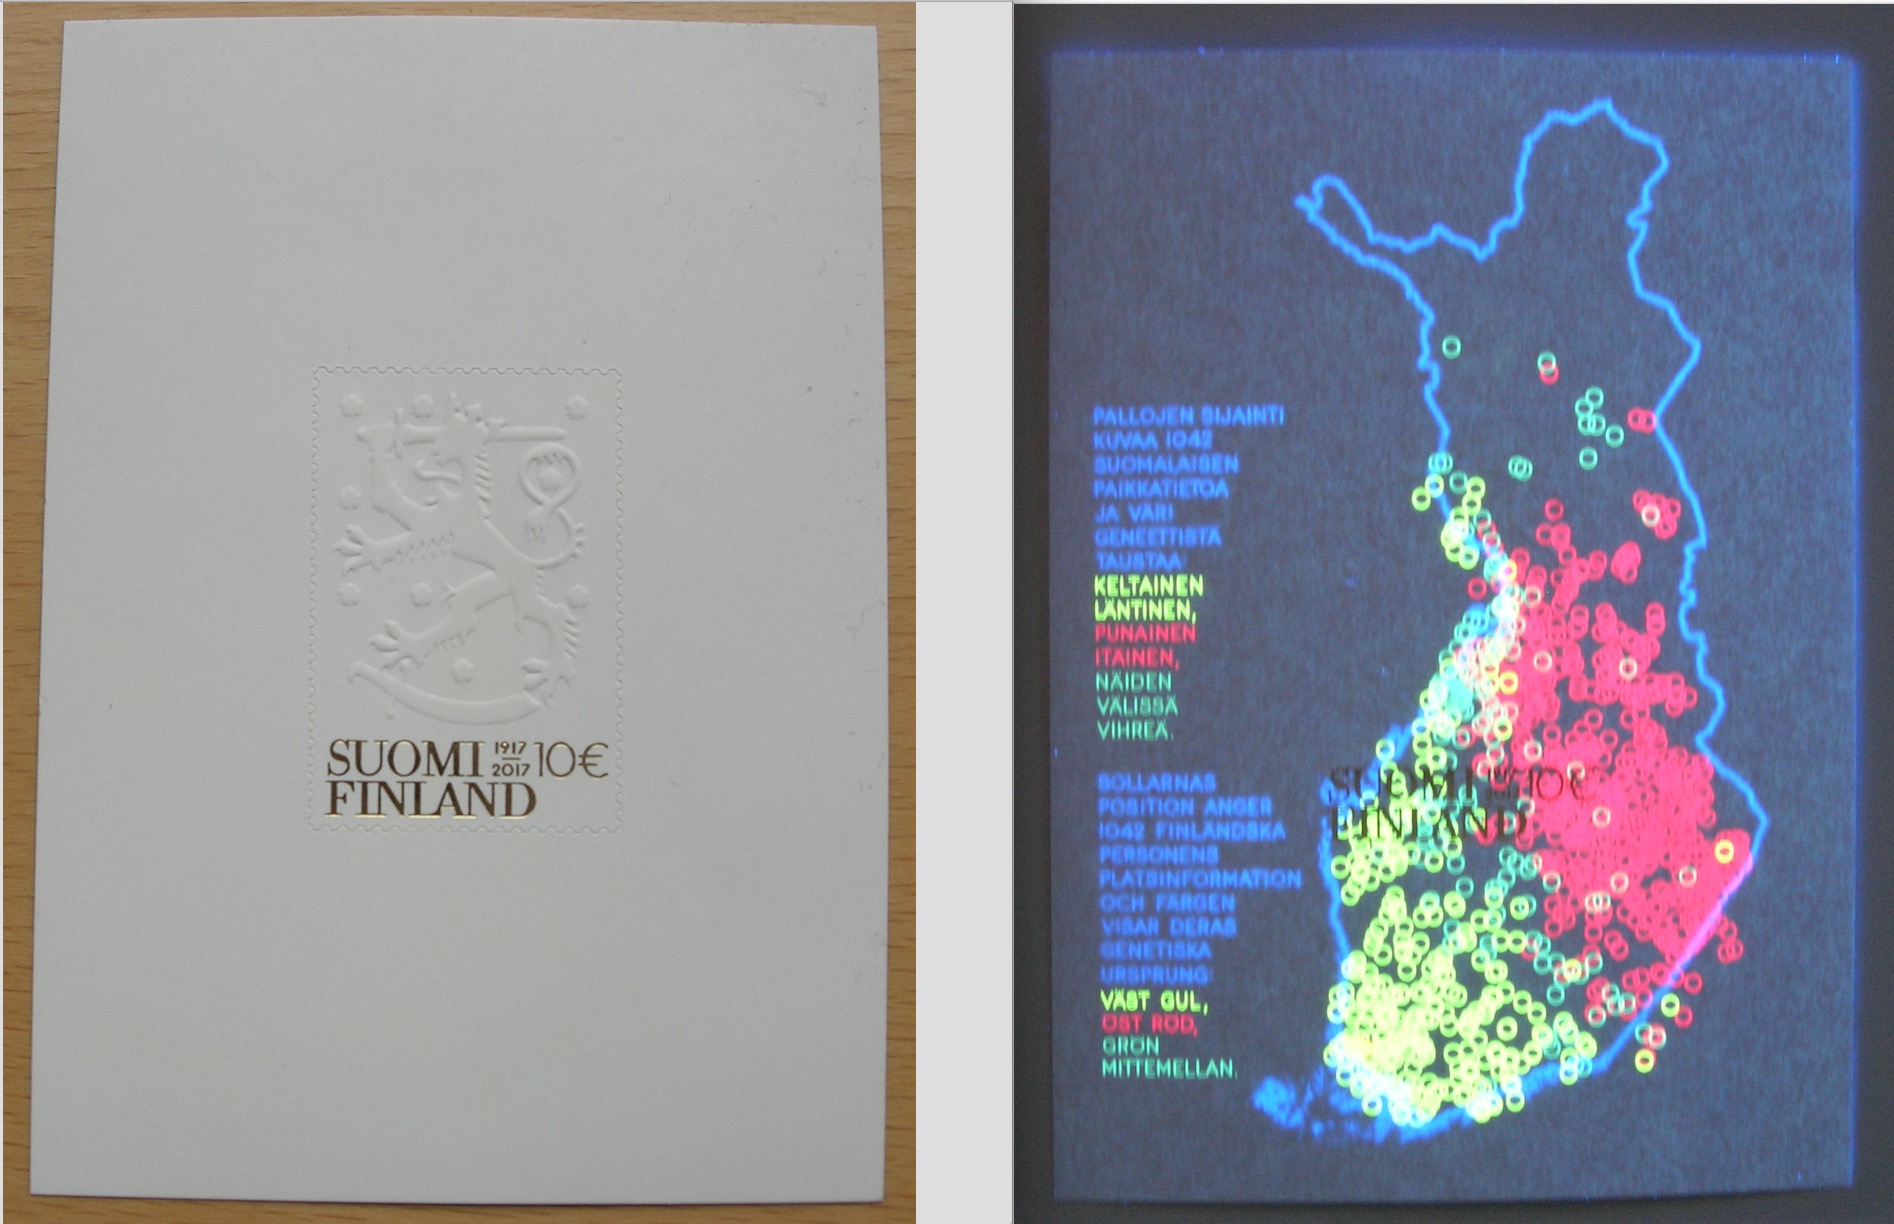
This year, in Finland, we are celebrating the first one hundred years as an independent country. Our history books tell many details of the past decades that have shaped the present day Finland. With modern technology we can complement the written history by another readable source that has literally travelled with our ancestors throughout millenia. This readable source is, of course, the human genome that we are studying at the Institute for Molecular Medicine Finland (FIMM) of University of Helsinki. A figure of our population genetic analysis based on the FINRISK study of the National Institute for Health and Welfare ended up in a special stamp designed by Pekka Piippo to celebrate Finland's 100th anniversary. It is a bit fancy stamp with a price tag of 10 euros and you can see our contribution in it only in UV-light!
Figure 1. Sheet of a special stamp called "Suomen vaakuna 2017" photographed from above. Left: in normal daylight. Right: in UV-light (Thanks Jaakko). The backside of the sheet has a photograph of a Finnish lake scenery by Martti Jämsä. The video below shows the tranformation between the types of light.
Below we show the original figure (Fig. 4) in a format that can be seen also in daylight(!), and describe its story and connections to the history of Finland in more detail.
Our genome is one of the most concrete links to our ancestors. We inherit two copies of this three billion letter DNA message from our parents and this message is stored in almost every cell of our bodies. There are only few changes (mutations) in the letters of the DNA sequence between two generations whereas long segments of the DNA are shuffled in every generation. For example, your maternal genome is an unprecedented combination of the genomes of your maternal grandmother and grandfather, and more generally, you genome is like a mosaic of the genomes of your ancestors (Fig. 2). With modern computational methods we can estimate the level of genetic relatedness between two present day genomes based on how many and how long chunks of DNA they share with each other (Fig. 3).
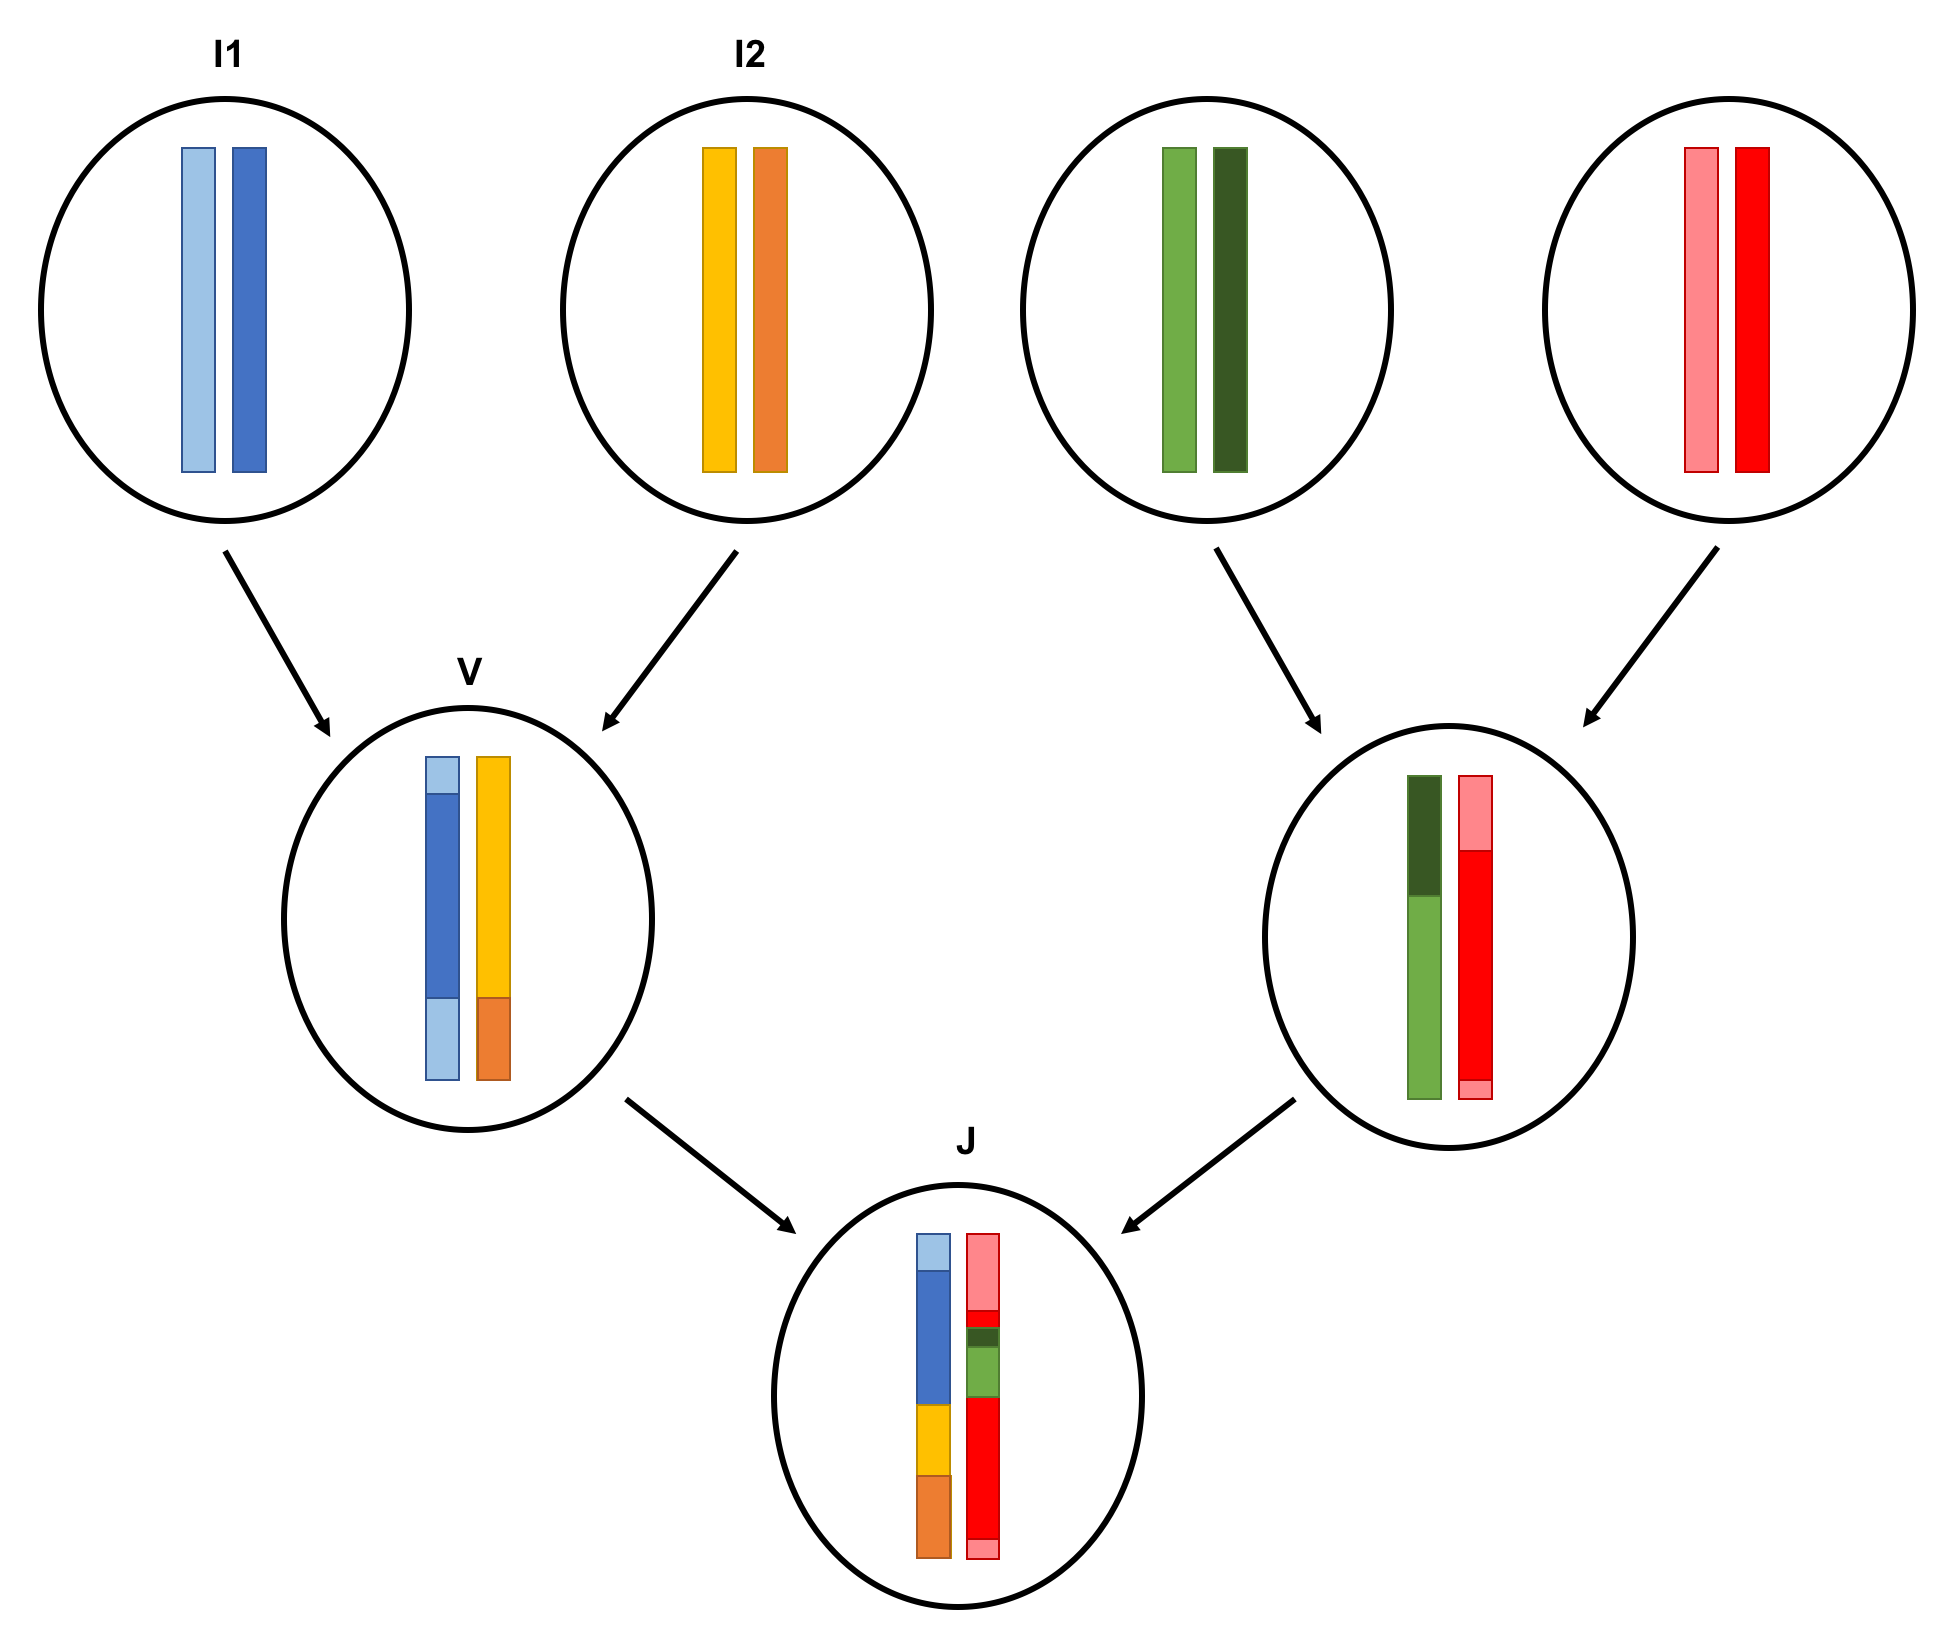
Figure 2. Genomic recombination between generations. Three generations are shown: 4 grandparents (top), 2 parents (middle) and an offspring (bottom). The two genomes of each individual are shown for a particular genomic segment. All 8 grandparental genomes are colored with separate colors. The parents inherit recombined genomes from the grandparents, e.g., parent V inherits from grandparent I1 a combination of light blue and dark blue genomes. Similarly, as a result of a recombination, offspring J inherits from parent V a genome that contains segments from all 4 genomes of grandparents I1 and I2. If we took the reference level of colored genomes further back in time to more distant ancestors, we would observe shorter intact segements, and more colorful genomes, in the offspring. (PNG, PDF, © Sini Kerminen, license: CC-BY 4.0.)
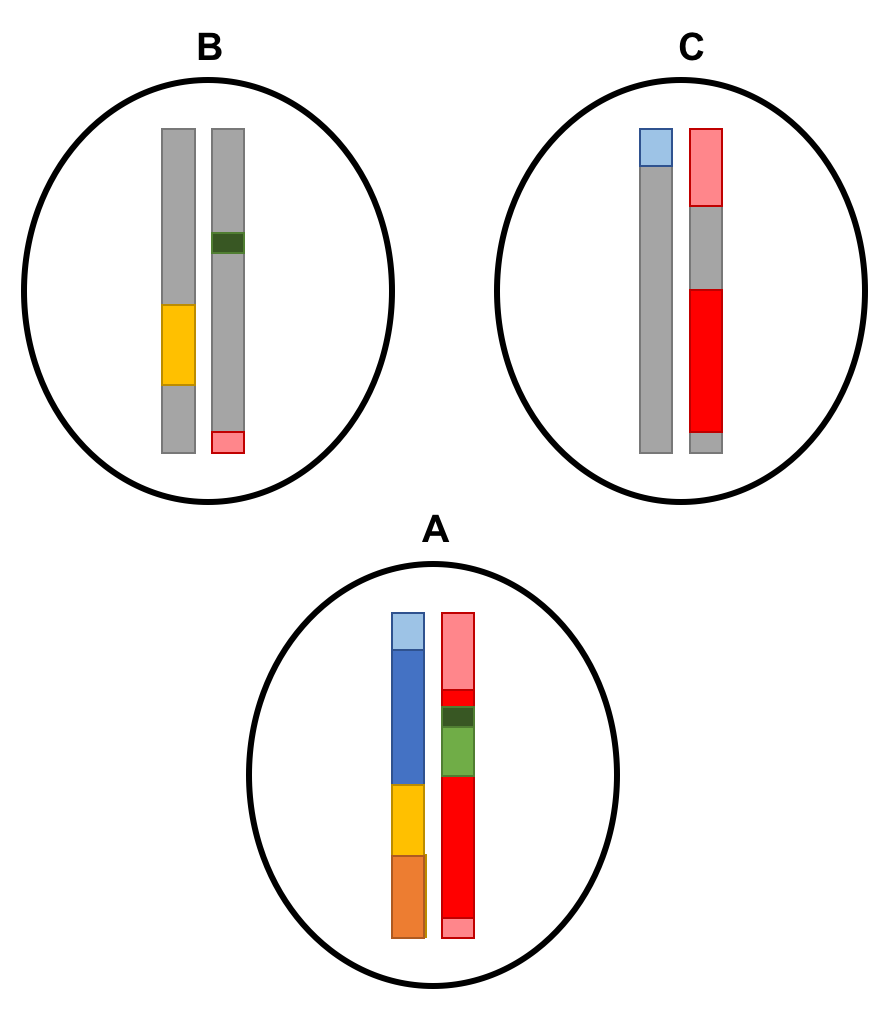
Figure 3. Estimating relatedness from shared segments. Two genomes of individual A are colored according to their ancestral origins with respect to some time point back in time (See Fig. 2). The two additional individuals B and C belong to the present day generation (as does A) and by computational methods we have estimated in which parts of the genome B and C share segements with A. The most probable matches have been colored and the rest of the genomes have been left gray. We estimate that C is a closer relative to A than B because C and A have more shared DNA from recent ancestors than B and A. (PNG, PDF, © Sini Kerminen, license: CC-BY 4.0.)
At the Institute for Molecular Medicine Finland (FIMM) of University of Helsinki we have applied computational methods to data from the FINRISK Study collected by the National Institute for Health and Welfare. Our goal was to study the fine-scale genetic structure within Finland. We included in our analyses only such individuals whose both parents were born closer than 80 km from each other because for these individuals we could assign a well defined geographical location based on the parents' birthplaces. By the birth years of the individuals included in the analysis we could estimate that the parents were born mostly before the year 1950. Thus, our results tell about the genetic structure in Finland that was present before 1950s. Altogether we had 1042 samples that covered well other parts of Finland except Lapland, where we had only a few samples, and the Islands of Aland, where we did not have any samples at all.
By clustering the samples into two groups based on genetic relatedness (Fig. 4) we saw clearly geographically motivated groups of western and southern Finland ("West", red) and eastern and northern Finland ("East", blue). This main division is in line with earlier results about relatively clear genetic differences between eastern and western Finland (Salmela 2008). A new contribution is the level of details. For the first time we can see in detail where the border line between East and West forms itself when we have a geographically uniformly distributed sample of over 1000 individuals from Finland. Additionally, we marked in Fig. 4 in cyan those individuals who showed considerable relatedness to both the eastern and western groups and for whom, therefore, the binary cluster assignment did not seem suitable.
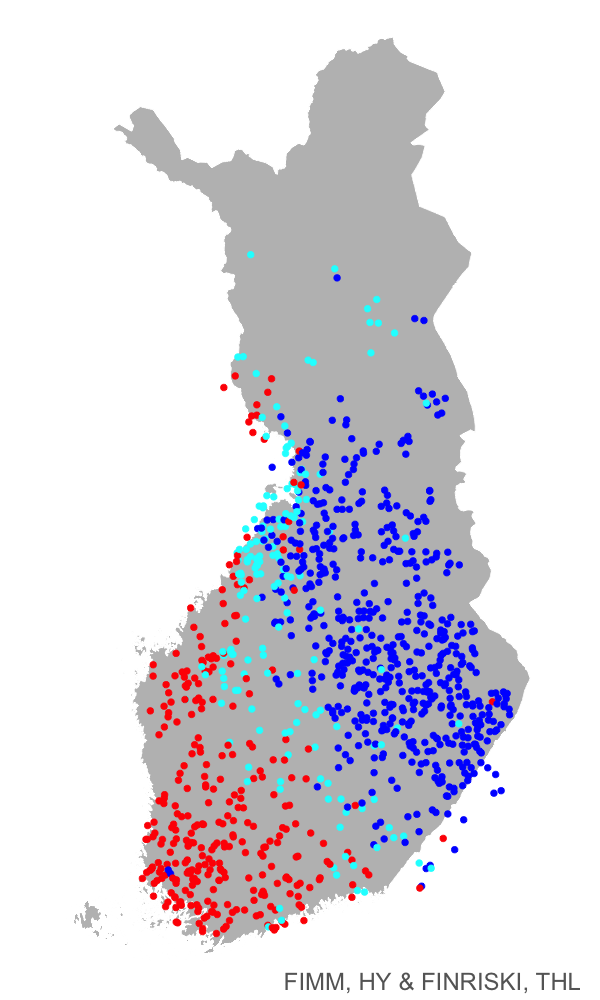
Figure 4. Position of the points represents the locations of 1042 Finnish individuals. By clustering the individuals into two groups based on genome data we see a split between eastern (blue) and western (red) parts. Individuals who show considerable relatedness to both groups have been colored with cyan. Both parents of each individual were born close to each other and based on the parents' birth years we can infer that we are looking at the genetic structure present in Finland before 1950s. (PNG, PDF, © FIMM, license: CC-BY 4.0.)
The genetic border matches well with the border line settled by the Treaty of Nöteborg in 1323 (Fig. 5). In this treaty the present day Finland was split between the kingdom of Sweden (to west of border) and the state of Novgorod (to east of border). Our results alone do not tell why these two borders match so well.
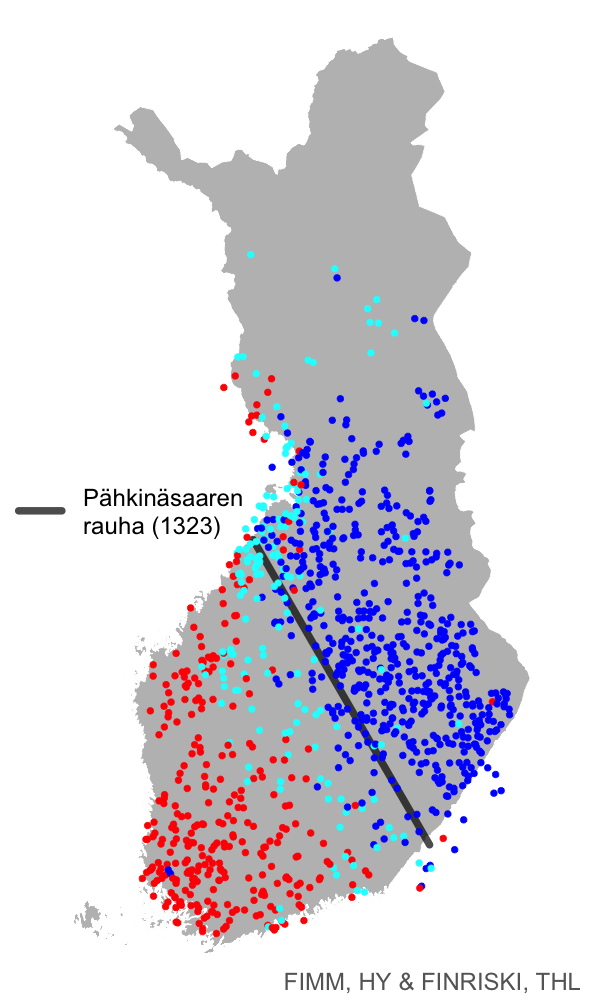
Figure 5. An estimated borderline of the Treaty of Nöteborg on top of the map from Fig. 4. The border line is drawn between Jääski (28.92 N, 61.04 E) and Pyhäjoki (24.26 N, 64.46 E). (PNG, PDF, © FIMM, license: CC-BY 4.0.)
According to historical records, a more permanent inhabitation of eastern and northern Finland started only in mid 1500s when settlers from Southern Savo region moved up to north (Jutikkala 1933). From the map we can see that Southern Savo is among the only regions of the early settlement region that is dominated by the eastern genetic group (Fig. 6). This observation can support the records of Southern Savonian settlers inhabiting large parts of the late settlement region of Finland.
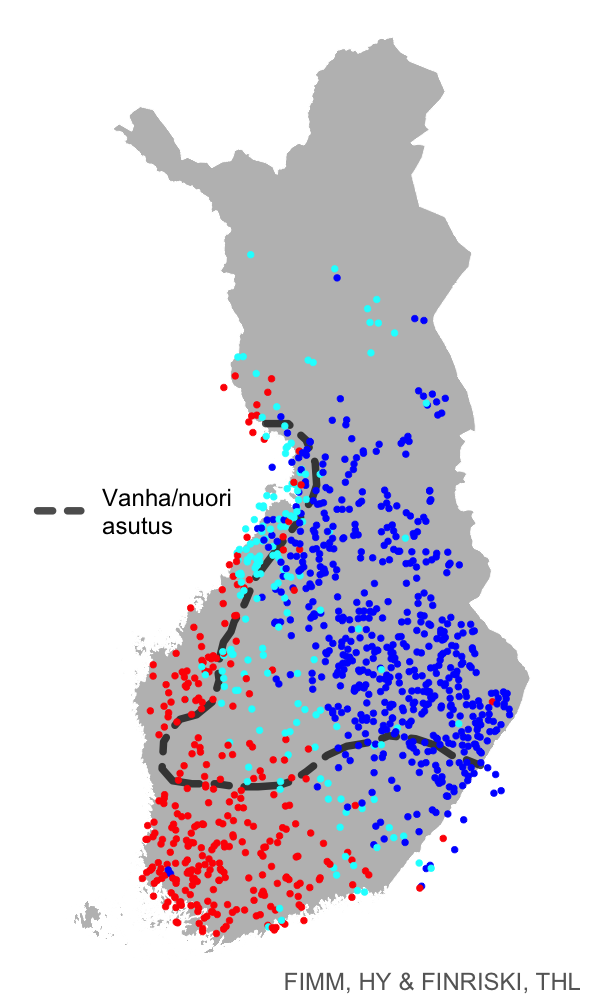
Figure 6. The settlement border divides Finland into the early settlement region (to west and south of the border) and the late settlement region (to east and north of the border) (Jutikkala 1933, s. 91). We see that Southern Savo (in south-eastern part of the early settlement) is among the only parts of the early settlement region that is dominated by the eastern genetic group. (PNG, PDF, © FIMM, license: CC-BY 4.0.)
Yes we do (see Kerminen et al. 2017). You can browse those results here.
No we do not. We have restricted our sample to individuals whose both parents were born in Finland and geographically close to each other because the genomes of these individuals tell the most precise story of the historical genetic structure within Finland. A large part of the present day Finns do not belong to this group because after 1950s there has been a lot of migration within the country, and increasingly also from abroad, but this does not make these Finns any less Finnish than the individuals who ended up in our analysis.
The focus of our work at FIMM is in the genetic factors affecting health and disease. When we assess the reliability and significance of our discoveries (e.g. a mutation that seems to increase the risk for heart disease) it is important to be able to compare their geographical distribution to the distribution of an average variant. The figures above visualize exactly this average geographical distribution of the genetic variation within Finland.
Additionally, these analyses and reference data create a basis for individual-level fine-scale ancestry estimation within Finland and group-level genetic relatedness estimation with respect to our geographical neighbors.
Matti Pirinen
Academy Research Fellow, Assistant Professor
Institute for Molecular Medicine Finland (FIMM) and
Department of Mathematics and Statistics and
Department of Public Health,
University of Helsinki.
Sini Kerminen (analyses)
Doctoral Student
Institute for Molecular Medicine Finland (FIMM) and
DocPop Graduate School,
University of Helsinki.
Research team:
Material:
The data collected by the National Institute for Health and Welfare (THL) for the
FINRISK Study.
Methods:
Software packages CHROMOPAINTER and FineSTRUCTURE.
Funding:
Institute for Molecular Medicine Finland (FIMM), DocPop Graduate School, University of Helsinki and the Academy of Finland.
References: