Plot|Splot|Output| Data|Multiplot|Batch
A figure can be formatted various ways:
With contours you must be careful with the format of the data files. Isolines (say, x-bins) must be separated by a blank line! If there are two blank lines, gnuplot thinks that a new data set follows.
If you don't have blank lines, you can add them with perl, shell or awk scripts. For example, an awk script that adds blanks based on the first column (written by unknown):
You can also write files that take arguments:
Gnuplot example session
Gnuplot is a command-driven interactive function plotting program. If files are given, gnuplot loads each file with the load command, in the order specified. Gnuplot exits after the last file is processed.Some features
- Plots any number of functions. Also support for plotting data files, to compare actual data to theoretical curves.
- User-defined X and Y ranges (optional auto-ranging), smart axes scaling, smart tic marks.
- Labeling of X and Y axes.
- User-defined constants and functions.
- Support for many output devices and file formats
- Shell escapes and command line substitution.
- Load and save capability.
- Output redirection.
Start/exit
In the command prompt, type gnuplot (Here UNIX type environment is assumed). An interactive gnuplot session is started. To exit, type exit into the gnuplot prompt.$ gnuplot (please, mind the wordwrap)
G N U P L O T
Version 4.2 patchlevel 0
last modified March 2007
System: Linux 2.6.21-1-686
Copyright (C) 1986 - 1993, 1998, 2004, 2007
Thomas Williams, Colin Kelley and many others
Type `help` to access the on-line reference manual.
The gnuplot FAQ is available from
http://www.gnuplot.info/faq/
Send comments and help requests to <gnuplot-info@lists.sourceforge.net>
Send bug reports and suggestions to <gnuplot-bugs@lists.sourceforge.net>
Terminal type set to 'wxt'
gnuplot> exit
You can also use quit to exit.
Plot
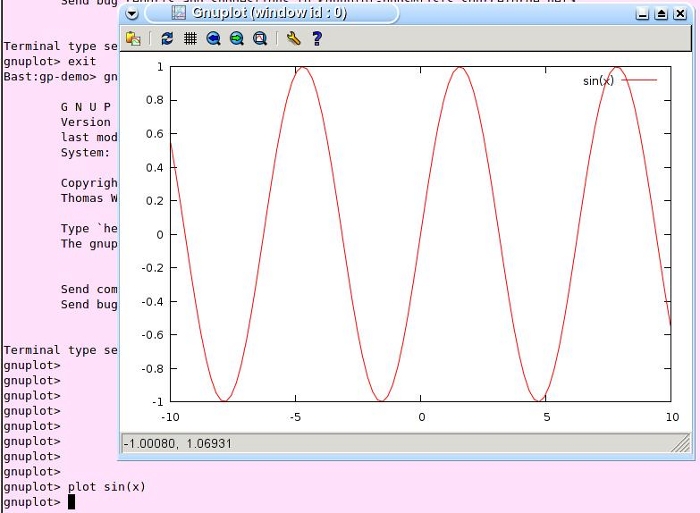
plot and splot are the primary commands in Gnuplot. plot is used to plot 2-d functions and data, while splot plots 3-d surfaces and data.gnuplot> plot sin(x)
A figure window opens
A figure can be formatted various ways:
gnuplot> set xrange [0:2*pi]
gnuplot> set xlabel "x"
gnuplot> plot sin(x), cos(x) title "c", x
Several functions can be plotted with one plot command by separating functions (and options) with a comma. In above, title sets the title for a curve. A title for the whole graph can be set as
gnuplot> set title "Figure 1"
Tics
The x and y tics can be controlled with set {x|y}tics. Similarly, for the smaller tics set m{x|y}tics ngnuplot> set xtics 1
gnuplot> set mxtics 5
gnuplot> set ytics 0.5
gnuplot> set mytics 5
Functions
User can define own functions for convenience.gnuplot> f(x)=sin(x)/x
gnuplot> plot f(x) with points
gnuplot> help with
... (Ctrl-c to abort help)
gnuplot> plot f(x) with filledcurves
gnuplot> plot f(x) with filledcurves above x1
Linestyles
Define a linestyle 22 (just a random; any (pos) integer can be chosen):gnuplot> set style line 22 linetype 3 linewidth 4 (please, mind the wordwrap)
Then you can use that style with any plot as an option
gnuplot> plot f(x) ls 22
Key
Legend can be boxed and set practically anywheregnuplot> set key box
gnuplot> set key left bottom
gnuplot> set key bmargin
For no key at all
gnuplot> set nokey
Splot
gnuplot> g(x,y)=x*y
gnuplot> splot g(x,y)
The figures can be rotated with mouse. unset view resets the viewpoint.
gnuplot> unset view
gnuplot> replot; #command is terminated with ;
gnuplot> # and hash is a comment character

gnuplot> set contour
gnuplot> set cntrparam levels 20
gnuplot> replot
gnuplot> set cntrparam levels disc -75,-50,0,5,20 (please, mind the wordwrap)
gnuplot> set contour surface; replot
gnuplot> set contour base; replot
gnuplot> set contour both; replot
gnuplot> set view map; replot
gnuplot> unset surface; replot
gnuplot> set grid; replot
gnuplot> reset
gnuplot> replot

gnuplot> unset view; set surface; replot
gnuplot> set hidden3d; replot
gnuplot> unset hidd
pm3d
pm3d draws palette-mapped colored surfacesgnuplot> set pm3d; replot
gnuplot> set pm3d at t; replot
gnuplot> set pm3d at b; replot
gnuplot> unset surf; set view map; replot
gnuplot> set cbrange [-50:40];replot
gnuplot> set palette gray; replot
gnuplot> set pale; rep
Output
Output type can be chosen from many different terminal typesPostscript
gnuplot> set terminal postscript eps enhanced color (please, mind the wordwrap)
Terminal type set to 'postscript'
Options are 'eps enhanced defaultplex \
   leveldefault color colortext \
   dashed dashlength 1.0 linewidth 1.0 butt \
   palfuncparam 2000,0.003 \
   "Helvetica" 14 '
gnuplot> set output "test.eps"
gnuplot> replot
gnuplot> set term pop; set out;
   restored terminal is wxt 0
Note that by default the output is directed to STDOUT. To redirect it into a file, set output filename must be used.
Other
gnuplot> help terminal
 Gnuplot supports a large number of output formats. These are selected by
 choosing an appropriate terminal type, possibly with additional modifying
 options. See `set terminal`.

 This document may describe terminal types that are not available to you
 because they were not configured or installed on your system. To see a list of
 terminals available on a particular gnuplot installation, type 'set terminal'
 with no modifiers.

Subtopics available for terminal:
    aed512            aed767            aifm              bitgraph
    cgm               corel             dumb              dxf
    eepic             emf               emtex             epslatex
    epson-180dpi      epson-60dpi       epson-lx800       fig
    gif               gpic              hp2623a           hp2648
    hp500c            hpdj              hpgl              hpljii
    hppj              imagen            jpeg              kc-tek40xx
    km-tek40xx        latex             mf                mif
    mp                nec-cp6           okidata           pbm
    pcl5              png               pop               postscript
    pslatex           pstex             pstricks          push
    qms               regis             selanar           starc
    svg               tandy-60dpi       tek40xx           tek410x
Press return for more:
    texdraw           tgif              tkcanvas          tpic
    vttek             wxt               x11               xlib

Subtopic of terminal:
 (please, mind the wordwrap)
Session
Session can be saved to a file for later usegnuplot> save "session.gp"
gnuplot> quit
At the shell:
$ gv test.eps
To continue with previous gnuplot session:
gnuplot> load "session.gp"
Data
! executes a shell:gnuplot> ! cat force.dat
# Deflection Col-Force Beam-Force
0.000 0 0
0.001 104 51
0.002 202 101
0.003 298 148
0.0031 290 149
0.004 289 201
0.0041 291 209
0.005 310 250
0.010 311 260
0.020 280 240
!
gnuplot> plot "force.dat" using 1:2 title "second col" w l, \
> "" using 1:3 title "third col" w l
(please, mind the wordwrap)
Note: you can continue the line with a \ followed by a line break.
With contours you must be careful with the format of the data files. Isolines (say, x-bins) must be separated by a blank line! If there are two blank lines, gnuplot thinks that a new data set follows.
gnuplot> ! cat test3d-1.dat
# X   Y    Z
  0   0    0
  0   1    1
  0   2    4
  0   3    9
  0   4   16
  0   5   25

  1   0    1
  1   1    2
  1   2    5
  1   3   10
  1   4   17

  2   0    4
  2   1    5
  2   2    8
  2   3   13

  3   0    9
  3   1   10
  3   2   13
!
gnuplot> splot "test3d-1.dat" w l
gnuplot> set cont; replot
Notice: Cannot contour non grid data. Please use "set dgrid3d".
gnuplot> ! cat test3d-2.dat
# X   Y    Z
  0   0    0
  0   1    1
  0   2    4
  0   3    9
  0   4   16
  0   5   25

  1   0    1
  1   1    2
  1   2    5
  1   3   10
  1   4   17
  1   5   26

  2   0    4
  2   1    5
  2   2    8
  2   3   13
  2   4   20
  2   5   29

  3   0    9
  3   1   10
  3   2   13
  3   3   18
  3   4   25
  3   5   34
!
gnuplot> splot "test3d-2.dat" w l
"Cannot contour non grid data" just means that you need for each X the same number of Y's (like in test3d-2.dat). Contours can be drawn even if the set of Y's is not the same for each X. "set dgrid3d" can give weird results, so use (more or less) rectangle data.
If you don't have blank lines, you can add them with perl, shell or awk scripts. For example, an awk script that adds blanks based on the first column (written by unknown):
 $ cat addblanks.awk
/[:blank:]*#/ {next} # ignore comments (lines starting with #)
NF < 3 {next} # ignore lines which don't have at least 3 columns
$1 != prev {printf "\n"; prev=$1} # print blank line
{print} # print the line
 (please, mind the wordwrap)
If your data lines have commas as field separators, insert BEGIN { FS = "," } at the beginning of the awk script (or whatever is your field separator). gnuplot understands the comma-separated-value data files after you issue the command
set datafile separator ",";Ordering of lines can be made with unix command sort (and uniq, if you have duplicate lines)
 splot "< sort -nk 1 -k 2 -k 5 filewithmanycolumns.data | awk -f addblanks.awk | uniq" \
 us 1:2:5 ti "my surface" with lines;
(please, mind the wordwrap)
Note that data is fed into gnuplot using shell redirection (<)
Multiplot
In the multiplot mode several plots are placed on the same page, window, or screen.gnuplot> set multiplot
multiplot> set size 1,0.5; set origin 0.0,0.5
multiplot> replot
multiplot> set origin 0,0
multiplot> splot x*y
multiplot> unset multiplot
gnuplot> quit
Multi-window
If you want multiple x11 windows on your screen, usegnuplot> set term x11 0 Terminal type set to 'x11' Options are '0 nopersist' gnuplot> splot x*y gnuplot> set term x11 1 Terminal type set to 'x11' Options are '1 nopersist' gnuplot> splot x**y
Batch
Gnuplot commands can be combined into a single script file. You can use batch files from shell: $ gnuplot file.gp
where file.gp contains gnuplot commands
You can also write files that take arguments:
 $ cat calltest.gp
print "argc=$# p0=$0 p1=$1 p2=$2 p3=$3 p4=$4 p5=$5 p6=$6 p7=x$7x"
(please, mind the wordwrap)
from gnuplot:
gnuplot> call "calltest.gp" "asdf" 1.2 + "'quoted'" -- "$2"
(please, mind the wordwrap)
Links
- http://www.gnuplot.info/help.html
- http://t16web.lanl.gov/Kawano/gnuplot/index-e.html
- http://www.duke.edu/~hpgavin/gnuplot.html